Electronic Arts 2002 Annual Report Download - page 44
Download and view the complete annual report
Please find page 44 of the 2002 Electronic Arts annual report below. You can navigate through the pages in the report by either clicking on the pages listed below, or by using the keyword search tool below to find specific information within the annual report.-
 1
1 -
2
-
3
-
4
-
5
-
6
-
7
-
8
-
9
-
10
-
11
-
12
-
13
-
14
-
15
-
16
-
17
-
18
-
19
-
20
-
21
-
22
-
23
-
24
-
25
-
26
-
27
-
28
-
29
-
30
-
31
-
32
-
33
-
 34
34 -
 35
35 -
 36
36 -
 37
37 -
 38
38 -
 39
39 -
 40
40 -
 41
41 -
 42
42 -
 43
43 -
 44
44 -
 45
45 -
 46
46 -
 47
47 -
 48
48 -
 49
49 -
 50
50 -
 51
51 -
 52
52 -
 53
53 -
 54
54 -
55
-
56
-
57
-
58
-
59
-
60
-
61
-
62
-
63
-
64
-
65
-
66
-
67
-
68
-
69
-
70
-
71
-
72
-
73
-
74
 |
 |

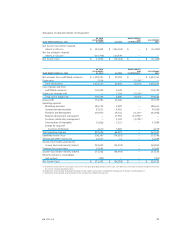
The following table below provides information about our foreign currency forward exchange contracts at
March 31, 2002.The information is provided in U.S. dollar equivalents and presents the notional amount
(forward amount), the weighted average contractual foreign currency exchange rates and fair value.
CONTRACT WEIGHTED-
AMOUNT AVERAGE FAIR VALUE
(In thousands) CONTRACT RATE (In thousands)
Foreign currency to be sold under contract:
British Pound $ 131,622 1.4229 $ (52)
Euro 41,121 0.8749 179
Canadian Dollar 16,986 1.5895 67
Japanese Yen 6,431 132.64 (5)
Swedish Krona 5,427 10.3189 43
Australian Dollar 4,206 0.5258 (58)
South African Rand 3,125 12.4801 (281)
Norwegian Krone 2,262 8.8409 13
Danish Krone 2,001 8.4965 10
Swiss Franc 1,199 1.6680 10
Total $ 214,380 $ (74)
Foreign currency to be purchased under contract:
British Pound $ 11,950 1.4253 $ (207)
Total $ 11,950 $ (207)
Grand total $ 226,330 $ (281)
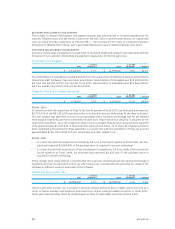
While the contract amounts provide one measurement of the volume of these transactions, they do not rep-
resent the amount of our exposure to credit risk.The amounts (arising from the possible inabilities of
counterparties to meet the terms of their contracts) are generally limited to the amounts, if any, by which
the counterparties’ obligations exceed our obligations as these contracts can be settled on a net basis at our
option.We control credit risk through credit approvals, limits and monitoring procedures.
Interest Rate Risk
Our exposure to market rate risk for changes in interest rates relates primarily to our investment portfolio.
We do not use derivative financial instruments in our investment portfolio.We manage our interest rate risk
by maintaining an investment portfolio primarily consisting of debt instruments of high credit quality and
relatively short average maturities.We also manage our interest rate risk by maintaining sufficient cash and
cash equivalent balances such that we are typically able to hold our investments to maturity. At March 31,
2002, our cash equivalents, short-term and long-term investments included debt securities of $662,359,000.
Notwithstanding our efforts to manage interest rate risks, there can be no assurances that we will be ade-
quately protected against the risks associated with interest rate fluctuations.
The table below presents the amounts and related weighted average interest rates of our investment
portfolio at March 31, 2002:
AVERAGE
(Dollars in thousands) INTEREST RATE COST FAIR VALUE
Cash equivalents(1)
Fixed rate 3.75% $ 10,141 $ 10,141
Variable rate 2.06% $ 408,108 $ 408,108
Short-term investments(1)(2)
Fixed rate 3.61% $ 235,769 $ 235,710
Variable rate 6.35% $ 8,400 $ 8,653
(1) See definition in Note 1 of the Notes to Consolidated Financial Statements.
(2) Maturity dates for short-term investments range from 3 months to 31 months with call dates ranging from 3 months to 10 months.
EA 2002 AR
40