Electronic Arts 2002 Annual Report Download - page 34
Download and view the complete annual report
Please find page 34 of the 2002 Electronic Arts annual report below. You can navigate through the pages in the report by either clicking on the pages listed below, or by using the keyword search tool below to find specific information within the annual report.-
 1
1 -
2
-
3
-
4
-
5
-
6
-
7
-
8
-
9
-
10
-
11
-
12
-
13
-
14
-
15
-
16
-
17
-
18
-
19
-
20
-
21
-
22
-
23
-
 24
24 -
 25
25 -
 26
26 -
 27
27 -
 28
28 -
 29
29 -
 30
30 -
 31
31 -
 32
32 -
 33
33 -
 34
34 -
 35
35 -
 36
36 -
 37
37 -
 38
38 -
 39
39 -
 40
40 -
 41
41 -
 42
42 -
 43
43 -
 44
44 -
45
-
46
-
47
-
48
-
49
-
50
-
51
-
52
-
53
-
54
-
55
-
56
-
57
-
58
-
59
-
60
-
61
-
62
-
63
-
64
-
65
-
66
-
67
-
68
-
69
-
70
-
71
-
72
-
73
-
74
 |
 |

Online Net Revenues
The increase in online revenues for fiscal 2001 as compared to fiscal 2000 was attributable to the following:
|•••»The average number of paying customers for
Ultima Online
increased to approximately 200,000 for
fiscal 2001 as compared to over 140,000 for fiscal 2000.This increase was due to continued strong
sales of
Ultima Online
,the addition of new events and parties within the
Ultima™
worlds and the release
of
Ultima Online Renaissance™
in April 2000.
|•••»We generated over $5,100,000 in subscription revenues for Kesmai and Worldplay online games for
fiscal 2001.These products were not part of EA.com in fiscal 2000 due to the Kesmai acquisition in
the fourth quarter of fiscal 2000.
License, OEM and Other Revenues
The decrease in license, OEM and other revenues for fiscal 2001 as compared to fiscal 2000 was primarily
a result of lower license revenue of certain titles on the Game Boy platform.
Advertising
Following the launch of EA.com on the worldwide web and the AOL Games Channel in October 2000, we
began selling advertising on EA.com and AOL properties, including the
Slingo
game. In addition, we gener-
ated advertising revenue from Pogo’s websites as a result of the purchase of Pogo in February 2001.
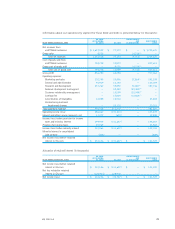
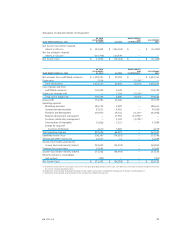
OPERATIONS BY SEGMENT
Information about our operations by segment for fiscal 2001 and 2000 is presented below (in thousands):
EA CORE ADJUSTMENTS
(EXCLUDING AND ELECTRONIC
YEAR ENDED MARCH 31, 2001 EA.COM) EA.COM ELIMINATIONS ARTS
Net revenues from unaffiliated customers $ 1,280,172 $ 42,101 $ — $ 1,322,273
Group sales 2,658 — (2,658)(a) —
Total net revenues 1,282,830 42,101 (2,658) 1,322,273
Cost of goods sold from
unaffiliated customers 640,239 12,003 — 652,242
Group cost of goods sold — 2,658 (2,658)(a) —
Total cost of goods sold 640,239 14,661 (2,658) 652,242
Gross profit 642,591 27,440 — 670,031
Operating expenses:
Marketing and sales 163,928 12,475 8,933(c) 185,336
General and administrative 93,885 10,156 — 104,041
Research and development 248,534 77,243 63,151(b) 388,928
Network development and support — 51,794 (51,794)(b) —
Customer relationship management — 11,357 (11,357)(b) —
Carriage fee — 8,933 (8,933)(c) —
Amortization of intangibles 12,829 6,494 — 19,323
Charge for acquired
in-process technology — 2,719 — 2,719
Total operating expenses 519,176 181,171 — 700,347
Operating income (loss) 123,415 (153,731) — (30,316)
Interest and other income, net 16,659 227 — 16,886
Income (loss) before benefit from
income taxes and minority interest 140,074 (153,504) — (13,430)
Benefit from income taxes (4,163) — — (4,163)
Income (loss) before minority interest 144,237 (153,504) — (9,267)
Minority interest in consolidated
joint venture (1,815) — — (1,815)
Net income (loss) before retained
interest in EA.com $ 142,422 $ (153,504) $ — $ (11,082)
EA 2002 AR
30