Electronic Arts 2002 Annual Report Download - page 6
Download and view the complete annual report
Please find page 6 of the 2002 Electronic Arts annual report below. You can navigate through the pages in the report by either clicking on the pages listed below, or by using the keyword search tool below to find specific information within the annual report.-
 1
1 -
 2
2 -
 3
3 -
 4
4 -
 5
5 -
 6
6 -
 7
7 -
 8
8 -
 9
9 -
 10
10 -
 11
11 -
 12
12 -
 13
13 -
 14
14 -
 15
15 -
 16
16 -
 17
17 -
18
-
19
-
20
-
21
-
22
-
23
-
24
-
25
-
26
-
27
-
28
-
29
-
30
-
31
-
32
-
33
-
34
-
35
-
36
-
37
-
38
-
39
-
40
-
41
-
42
-
43
-
44
-
45
-
46
-
47
-
48
-
49
-
50
-
51
-
52
-
53
-
54
-
55
-
56
-
57
-
58
-
59
-
60
-
61
-
62
-
63
-
64
-
65
-
66
-
67
-
68
-
69
-
70
-
71
-
72
-
73
-
74
 |
 |

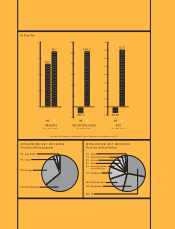
By Fiscal Year
WORLDWIDE NET REVENUE
Fiscal Year 2002 by Geography
WORLDWIDE NET REVENUE
Fiscal Year 2002 by Platform
28% PlayStation 2
26% PC
5% Xbox
3% Nintendo GameCube
2% Other
11% PlayStation
5% Game Boy Advance/
Game Boy Color
16% Affiliated Labels
4% EA.com
30%
Europe
63%
North America
4% Japan
3% Asia Pacific
0.0
0.5
1.0
1.5
2.0
REVENUE
(In billions)
$1.7
$1.3
01 02
*See Note 1(o) of Notes to Consolidated Financial Statements for an explanation of EPS.
NET INCOME (LOSS)
(In millions)
($11.1)
$101.5
01 02
-20
0
20
40
60
80
100
120
EPS*
(In dollars)
01 02
$0.71
($0.08)
-0.10
0.00
0.10
0.20
0.30
0.40
0.50
0.60
0.70
0.80