Electronic Arts 2002 Annual Report Download - page 50
Download and view the complete annual report
Please find page 50 of the 2002 Electronic Arts annual report below. You can navigate through the pages in the report by either clicking on the pages listed below, or by using the keyword search tool below to find specific information within the annual report.-
 1
1 -
2
-
3
-
4
-
5
-
6
-
7
-
8
-
9
-
10
-
11
-
12
-
13
-
14
-
15
-
16
-
17
-
18
-
19
-
20
-
21
-
22
-
23
-
24
-
25
-
26
-
27
-
28
-
29
-
30
-
31
-
32
-
33
-
34
-
35
-
36
-
37
-
38
-
39
-
 40
40 -
 41
41 -
 42
42 -
 43
43 -
 44
44 -
 45
45 -
 46
46 -
 47
47 -
 48
48 -
 49
49 -
 50
50 -
 51
51 -
 52
52 -
 53
53 -
 54
54 -
 55
55 -
 56
56 -
 57
57 -
 58
58 -
 59
59 -
 60
60 -
61
-
62
-
63
-
64
-
65
-
66
-
67
-
68
-
69
-
70
-
71
-
72
-
73
-
74
 |
 |

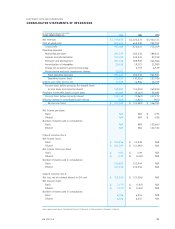
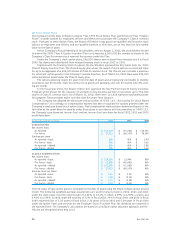
(In thousands)
YEARS ENDED MARCH 31, 2002 2001 2000
Operating Activities
Net income (loss) $101,509 $(11,082) $ 116,751
Adjustments to reconcile net income (loss)
to net cash provided by operating activities:
Minority interest in consolidated joint venture 809 1,815 421
Equity in net income of affiliates (2,999) (820) (1,138)
Gain on sale of affiliate (200) (214) (842)
Depreciation and amortization 110,901 78,601 46,725
Non-cash restructuring and asset impairment charges 13,399 ——
Loss on sale of fixed assets 331 1,992 31
(Gain) loss on marketable securities 96 —(7,528)
Bad debt expense 9,361 7,541 6,714
Charge for acquired in-process technology —2,719 6,539
Tax benefit from exercise of stock options 22,541 25,750 32,563
Change in assets and liabilities, net of acquisitions:
Receivables (25,407) 53,775 (77,779)
Inventories (8,094) 7,300 (579)
Other assets (1,718) (4,238) (69,727)
Accounts payable 15,502 (27,476) 29,673
Accrued and other liabilities 90,996 91,356 (6,919)
Deferred income taxes (42,056) (33,080) 2,994
Net cash provided by operating activities 284,971 193,939 77,899
Investing Activities
Proceeds from sale of property and equipment 299 4,134 444
Proceeds from sales of marketable securities, net ——8,598
Proceeds from sale of affiliate 570 —8,842
Capital expenditures (51,518) (120,347) (134,884)
Investment in affiliates, net 2,919 1,662 (4,099)
Purchase of marketable securities —(2,479) —
Dividend to joint venture (2,481) ——
Change in short-term investments, net (190,342) 46,907 (13,860)
Acquisition of Pogo Corporation, net of cash acquired —(42,571) —
Acquisition of Kesmai ——(22,500)
Acquisition of other subsidiaries, net of cash acquired ——(22,096)
Net cash used in investing activities (240,553) (112,694) (179,555)
Financing Activities
Proceeds from sales of Class A shares through employee
stock plans and other plans 98,741 101,996 85,589
Proceeds from sales of Class B shares and stock warrants 99 632 20,000
Purchase of treasury shares (11,922) ——
Net cash provided by financing activities 86,918 102,628 105,589
Translation adjustment 1,678 (10,326) 124
Increase in cash and cash equivalents 133,014 173,547 4,057
Beginning cash and cash equivalents 419,812 246,265 242,208
Ending cash and cash equivalents 552,826 419,812 246,265
Short-term investments 244,110 46,680 93,539
Ending cash, cash equivalents and short-term investments $796,936 $466,492 $ 339,804
Supplemental cash flow information:
Cash paid during the year for income taxes $9,955 $13,556 $ 15,525
Non-cash investing activities:
Class B common stock issued in connection with
the Kesmai acquisition $—$—$9,353
Change in unrealized appreciation (depreciation)
of investments and marketable securities $(5,035) $4,488 $ (5,008)
See accompanying Notes to Consolidated Financial Statements.
EA 2002 AR
46
ELECTRONIC ARTS AND SUBSIDIARIES
CONSOLIDATED STATEMENTS OF CASH FLOWS