Electronic Arts 2002 Annual Report Download - page 37
Download and view the complete annual report
Please find page 37 of the 2002 Electronic Arts annual report below. You can navigate through the pages in the report by either clicking on the pages listed below, or by using the keyword search tool below to find specific information within the annual report.-
 1
1 -
2
-
3
-
4
-
5
-
6
-
7
-
8
-
9
-
10
-
11
-
12
-
13
-
14
-
15
-
16
-
17
-
18
-
19
-
20
-
21
-
22
-
23
-
24
-
25
-
26
-
 27
27 -
 28
28 -
 29
29 -
 30
30 -
 31
31 -
 32
32 -
 33
33 -
 34
34 -
 35
35 -
 36
36 -
 37
37 -
 38
38 -
 39
39 -
 40
40 -
 41
41 -
 42
42 -
 43
43 -
 44
44 -
 45
45 -
 46
46 -
 47
47 -
48
-
49
-
50
-
51
-
52
-
53
-
54
-
55
-
56
-
57
-
58
-
59
-
60
-
61
-
62
-
63
-
64
-
65
-
66
-
67
-
68
-
69
-
70
-
71
-
72
-
73
-
74
 |
 |

Marketing and Sales
% OF NET % OF NET
2001 REVENUES 2000 REVENUES % CHANGE
$185,336,000 14.0% $ 188,611,000 13.3% (1.7%)
Marketing and sales expenses for fiscal 2001 increased as a percentage of revenue, primarily attributed to:
|•••»Higher EA.com marketing and sales expenses due to increased staff required to support the live game
site and advertising campaigns run on the AOL service promoting the Games Channel.
|•••»The amortization of the AOL Carriage Fee, which began with the launch of EA.com in October 2000.
|•••»Offset by lower television and print advertising in North America and Europe due to fewer number of
releases compared to fiscal 2000.
General and Administrative
% OF NET % OF NET
2001 REVENUES 2000 REVENUES % CHANGE
$104,041,000 7.9% $ 92,418,000 6.5% 12.6%
General and administrative expenses increased 12.6% for fiscal 2001, primarily attributed to:
|•••»The expansion of the EA.com staff and additional administrative-related costs required to support the
growth of the EA.com business.
|•••»Increase in bad debts due to a write off of a receivable as a result of the default of payment from a
customer in Europe for approximately $1,000,000.
|•••»Increase in depreciation expense for Europe due to the implementation of a new transaction pro-
cessing system.
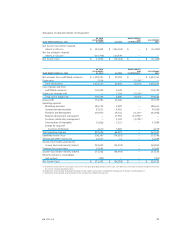
Research and Development
% OF NET % OF NET
2001 REVENUES 2000 REVENUES % CHANGE
Research and development $ 325,777,000 24.6% $ 240,649,000 16.9% 35.4%
Network development
and support 51,794,000 3.9% 17,993,000 1.3% 187.9%
Customer relationship
management 11,357,000 0.9% 3,324,000 0.2% 241.7%
Total research and
development $ 388,928,000 29.4% $ 261,966,000 18.4% 48.5%
RESEARCH AND DEVELOPMENT (EXCLUDING NETWORK DEVELOPMENT
AND SUPPORT AND CUSTOMER RELATIONSHIP MANAGEMENT)
Research and development expenses (excluding Network Development and Support and Customer Relation-
ship Management) increased in absolute dollars by 35.4% for fiscal 2001, primarily attributed to:
|•••»Increase in research and development expenses by EA.com (including expenses incurred by EA Core
on behalf of EA.com) due to an increase in the number of online projects in development and increased
development staff to support these products.
|•••»An increase in development spending for next generation console products including development for
the PlayStation 2 console, Xbox and Nintendo GameCube.
|•••»The increase is also due to research and development expenses related to the acquisition of Dream-
Works Interactive, a software development company, in the fourth quarter of fiscal 2000.
We released a total of 55 new packaged goods products in fiscal 2001 compared to 69 new products in fis-
cal 2000. In addition, the EA.com website launched in October 2000, and had over 80 live games.
EA 2002 AR 33