Electronic Arts 2002 Annual Report Download - page 39
Download and view the complete annual report
Please find page 39 of the 2002 Electronic Arts annual report below. You can navigate through the pages in the report by either clicking on the pages listed below, or by using the keyword search tool below to find specific information within the annual report.-
 1
1 -
2
-
3
-
4
-
5
-
6
-
7
-
8
-
9
-
10
-
11
-
12
-
13
-
14
-
15
-
16
-
17
-
18
-
19
-
20
-
21
-
22
-
23
-
24
-
25
-
26
-
27
-
28
-
 29
29 -
 30
30 -
 31
31 -
 32
32 -
 33
33 -
 34
34 -
 35
35 -
 36
36 -
 37
37 -
 38
38 -
 39
39 -
 40
40 -
 41
41 -
 42
42 -
 43
43 -
 44
44 -
 45
45 -
 46
46 -
 47
47 -
 48
48 -
 49
49 -
50
-
51
-
52
-
53
-
54
-
55
-
56
-
57
-
58
-
59
-
60
-
61
-
62
-
63
-
64
-
65
-
66
-
67
-
68
-
69
-
70
-
71
-
72
-
73
-
74
 |
 |

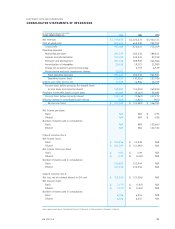
Income Taxes
EFFECTIVE EFFECTIVE
2001 TAX RATE 2000 TAX RATE % CHANGE
$(4,163,000) 31.0% $ 52,642,000 31.0% (107.9%)
Our effective tax rate was 31.0% for fiscal 2001 and fiscal 2000. At March 31, 2001, we generated a fed-
eral income tax net operating loss. A substantial portion of this loss was utilized in a carryback claim with
the remainder being carried forward. A valuation allowance was not established on this loss carryforward
or other net deferred tax assets as we believed it was more likely than not that the results of future opera-
tions would generate sufficient taxable income to realize them.
Net Income (loss)
% OF NET % OF NET
2001 REVENUES 2000 REVENUES % CHANGE
$(11,082,000) (0.8%) $ 116,751,000 8.2% (109.5%)
In absolute dollars, reported net income (loss) decreased in fiscal 2001 primarily related to lower revenues
as well as higher costs and expenses compared to fiscal 2000.The decrease in revenues was primarily due to
the beginning of the transition period to next generation console systems.The increase in expenses was pri-
marily due to increases in development of next generation console products in the Core business and the
investment in EA.com, including expenses to build network and online game products and to launch our
game sites in October 2000.
Excluding goodwill, non-cash compensation and one-time charges in the amount of $17,077,000, net
of taxes, for fiscal 2001, net income would have been $5,995,000. Excluding goodwill, non-cash compensa-
tion and one-time charges in the amount of $13,292,000, net of taxes, for fiscal 2000, net income would
have been $130,043,000.
LIQUIDITY AND CAPITAL RESOURCES
EA CORE AND EA.COM
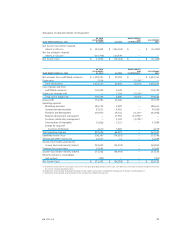
As of March 31, 2002, our working capital was $699,561,000 compared to $478,701,000 at March 31,
2001. Cash, cash equivalents and short-term investments increased by $330,444,000 in fiscal 2002. We
generated $284,971,000 of cash from operations, $98,840,000 of cash through the sale of equity securi-
ties under our stock plans, offset by $51,518,000 of cash used in capital expenditures during fiscal 2002.
Reserves for bad debts and sales returns increased from $89,833,000 at March 31, 2001 to
$115,870,000 at March 31, 2002. Reserves have been charged for returns of product and price protection
credits issued for products sold in prior periods. Management believes these reserves are adequate based on
historical experience and its current estimate of potential returns and allowances.
Our principal source of liquidity is $796,936,000 in cash, cash equivalents and short-term investments
and $6,869,000 in marketable securities.We expect that for the foreseeable future, our operating expenses
will constitute a significant use of our cash balances. Management believes the existing cash, cash equiva-
lents, short-term investments, marketable securities and cash generated from operations will be sufficient to
meet cash and investment requirements on both a short-term and long-term basis. However, our ability to
maintain sufficient liquidity could be affected by various risks and uncertainties, including but not limited to,
those related to customer demand and acceptance of titles on new platforms and new title versions on existing
platforms, our ability to collect our accounts receivable as they become due, successfully achieving our prod-
uct release schedules and attaining our forecasted sales objectives, the impact of competition, the economic
conditions in the domestic and international markets, seasonality in operating results, risks of product
returns and the other risks listed in the “Risk Factors” section.
EA 2002 AR 35