Ford 2010 Annual Report Download - page 157
Download and view the complete annual report
Please find page 157 of the 2010 Ford annual report below. You can navigate through the pages in the report by either clicking on the pages listed below, or by using the keyword search tool below to find specific information within the annual report.-
 1
1 -
2
-
3
-
4
-
5
-
6
-
7
-
8
-
9
-
10
-
11
-
12
-
13
-
14
-
15
-
16
-
17
-
18
-
19
-
20
-
21
-
22
-
23
-
24
-
25
-
26
-
27
-
28
-
29
-
30
-
31
-
32
-
33
-
34
-
35
-
36
-
37
-
38
-
39
-
40
-
41
-
42
-
43
-
44
-
45
-
46
-
47
-
48
-
49
-
50
-
51
-
52
-
53
-
54
-
55
-
56
-
57
-
58
-
59
-
60
-
61
-
62
-
63
-
64
-
65
-
66
-
67
-
68
-
69
-
70
-
71
-
72
-
73
-
74
-
75
-
76
-
77
-
78
-
79
-
80
-
81
-
82
-
83
-
84
-
85
-
86
-
87
-
88
-
89
-
90
-
91
-
92
-
93
-
94
-
95
-
96
-
97
-
98
-
99
-
100
-
101
-
102
-
103
-
104
-
105
-
106
-
107
-
108
-
109
-
110
-
111
-
112
-
113
-
114
-
115
-
116
-
117
-
118
-
119
-
120
-
121
-
122
-
123
-
124
-
125
-
126
-
127
-
128
-
129
-
130
-
131
-
132
-
133
-
134
-
135
-
136
-
137
-
138
-
139
-
140
-
141
-
142
-
143
-
144
-
145
-
146
-
 147
147 -
 148
148 -
 149
149 -
 150
150 -
 151
151 -
 152
152 -
 153
153 -
 154
154 -
 155
155 -
 156
156 -
 157
157 -
 158
158 -
 159
159 -
 160
160 -
 161
161 -
 162
162 -
 163
163 -
 164
164 -
 165
165 -
 166
166 -
 167
167 -
168
-
169
-
170
-
171
-
172
-
173
-
174
-
175
-
176
-
177
-
178
-
179
-
180
-
181
-
182
-
183
-
184
 |
 |

Notes to the Financial Statements
Ford Motor Company | 2010 Annual Report 155
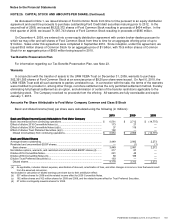
NOTE 23. INCOME TAXES (Continued)
Components of Income Taxes
Components of income taxes excluding discontinued operations, cumulative effects of changes in accounting
principles, other comprehensive income, and equity in net results of affiliated companies accounted for after-tax, are as
follows:
2010
20102010
2010
2009
20092009
2009
2008
20082008
2008
Income/(Loss) before income taxes, excluding equity in net results of affiliated
Income/(Loss) before income taxes, excluding equity in net results of affiliated Income/(Loss) before income taxes, excluding equity in net results of affiliated
Income/(Loss) before income taxes, excluding equity in net results of affiliated
companies accounted for after
companies accounted for aftercompanies accounted for after
companies accounted for after-
---tax (in millions)
tax (in millions)tax (in millions)
tax (in millions)
U.S.................................................................................................
................................
$ 4,057 $ 1,724 $ (16,148)
Non-U.S. ................................................................................................
................................
2,554 680 872
Total ................................................................................................
................................
$ 6,611 $ 2,404 $ (15,276)
Provision for/(Benefit from) income taxes (in millions)
Provision for/(Benefit from) income taxes (in millions)Provision for/(Benefit from) income taxes (in millions)
Provision for/(Benefit from) income taxes (in millions)
Current
Federal................................................................................................
................................
$ (69) $ (274) $ (117)
Non-U.S. ................................................................................................
................................
289 269 417
State and local ................................................................................................
................................
(5) 7 36
Total current................................................................................................
................................
215 2 336
Deferred
Federal................................................................................................
................................
— (100) 94
Non-U.S. ................................................................................................
................................
292 44 (433)
State and local ................................................................................................
................................
85 (59) (59)
Total deferred................................................................................................
................................
377 (115) (398)
Total ................................................................................................
................................
$ 592 $ (113) $ (62)
Reconciliation of effective tax rate
Reconciliation of effective tax rateReconciliation of effective tax rate
Reconciliation of effective tax rate
U.S. tax at statutory rate ................................................................
................................
35.0% 35.0% 35.0%
Non-U.S. income taxes ................................................................
................................
1.2 (0.8) 0.9
State and local income taxes ................................................................
................................
1.5 (1.9) 0.2
General business credits................................................................
................................
(1.8) (6.2) 1.0
Dispositions and restructurings ................................................................
................................
(9.5) (4.3) 15.1
Medicare prescription drug benefit................................................................
................................
— — 0.5
Prior year settlements and claims ................................................................
................................
(10.0) 10.4 (0.5)
Tax-related interest ................................................................................................
...............................
(0.7) (1.5) 0.5
Other................................................................................................
................................
(1.0) 1.0 (0.2)
Valuation allowance ................................................................................................
..............................
(5.7) (36.4) (52.1)
Effective rate ................................................................................................
................................
9.0% (4.7)% 0.4%
No provision for deferred taxes has been made on $812 million of unremitted earnings that are permanently invested
in our non-U.S. operating assets.