Ford 2010 Annual Report Download - page 171
Download and view the complete annual report
Please find page 171 of the 2010 Ford annual report below. You can navigate through the pages in the report by either clicking on the pages listed below, or by using the keyword search tool below to find specific information within the annual report.-
 1
1 -
2
-
3
-
4
-
5
-
6
-
7
-
8
-
9
-
10
-
11
-
12
-
13
-
14
-
15
-
16
-
17
-
18
-
19
-
20
-
21
-
22
-
23
-
24
-
25
-
26
-
27
-
28
-
29
-
30
-
31
-
32
-
33
-
34
-
35
-
36
-
37
-
38
-
39
-
40
-
41
-
42
-
43
-
44
-
45
-
46
-
47
-
48
-
49
-
50
-
51
-
52
-
53
-
54
-
55
-
56
-
57
-
58
-
59
-
60
-
61
-
62
-
63
-
64
-
65
-
66
-
67
-
68
-
69
-
70
-
71
-
72
-
73
-
74
-
75
-
76
-
77
-
78
-
79
-
80
-
81
-
82
-
83
-
84
-
85
-
86
-
87
-
88
-
89
-
90
-
91
-
92
-
93
-
94
-
95
-
96
-
97
-
98
-
99
-
100
-
101
-
102
-
103
-
104
-
105
-
106
-
107
-
108
-
109
-
110
-
111
-
112
-
113
-
114
-
115
-
116
-
117
-
118
-
119
-
120
-
121
-
122
-
123
-
124
-
125
-
126
-
127
-
128
-
129
-
130
-
131
-
132
-
133
-
134
-
135
-
136
-
137
-
138
-
139
-
140
-
141
-
142
-
143
-
144
-
145
-
146
-
147
-
148
-
149
-
150
-
151
-
152
-
153
-
154
-
155
-
156
-
157
-
158
-
159
-
160
-
 161
161 -
 162
162 -
 163
163 -
 164
164 -
 165
165 -
 166
166 -
 167
167 -
 168
168 -
 169
169 -
 170
170 -
 171
171 -
 172
172 -
 173
173 -
 174
174 -
 175
175 -
 176
176 -
 177
177 -
 178
178 -
 179
179 -
 180
180 -
 181
181 -
182
-
183
-
184
 |
 |

Notes to the Financial Statements
Ford Motor Company | 2010 Annual Report 169
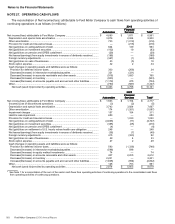
NOTE 27. OPERATING CASH FLOWS (Continued)
2008
20082008
2008
Automotive
AutomotiveAutomotive
Automotive
Financial
Financial Financial
Financial
Services
ServicesServices
Services
Total
TotalTotal
Total*
***
Net income/(loss) attributable to Ford Motor Company ................................
...........................
$ (13,174) $ (1,592) $ (14,766)
(Income)/Loss of discontinued operations ................................................................
.............
— (9) (9)
Depreciation and special tools amortization ................................
................................
5,513 7,023 12,536
Other amortization ................................................................................................
................
274 (643) (369)
Impairment charges ................................................................................................
..............
5,318 2,086 7,404
Held-for-sale impairment................................................................
................................
421 — 421
U.S. consolidated dealerships goodwill impairment................................
...............................
88 — 88
Provision for credit and insurance losses ................................................................
..............
— 1,874 1,874
Net (gain)/loss on extinguishment of debt ................................................................
.............
(170) — (170)
Net (gain)/loss on investment securities................................................................
................
1,364 12 1,376
Net (gain)/loss on pension and OPEB curtailment ................................
................................
(2,714) — (2,714)
Net losses/(earnings) from equity investments in excess of dividends received
....................
42 (4) 38
Foreign currency adjustments................................................................
...............................
(499) (4) (503)
Net (gain)/loss on sale of businesses................................................................
....................
551 (29) 522
Stock option expense................................................................................................
............
32 3 35
Cash changes in operating assets and liabilities were as follows:
Provision for deferred income taxes ................................................................
...................
3,561 (1,681) 1,880
Decrease/(Increase) in intersector receivables/payables ................................
....................
885 (885) —
Decrease/(Increase) in equity method investments ................................
............................
(139) — (139)
Decrease/(Increase) in accounts receivable and other assets................................
............
(1,473) 2,446 973
Decrease/(Increase) in inventory................................................................
........................
(137) — (137)
Increase/(Decrease) in accounts payable and accrued and other liabilities
........................
(13,557) 1,258 (12,299)
Other................................................................................................
................................
1,208 (666) 542
Net cash (used in)/provided by operating activities ................................
...........................
$ (12,606) $ 9,189 $ (3,417)
* See Note 1 for a reconciliation of the sum of the sector cash flows from operating activities of continuing operations to the consolidated cash flows
from operating activities of continuing operations.
Cash paid/(received) for interest and income taxes for continuing operations was as follows (in millions):
2010
20102010
2010
2009
20092009
2009
2008
20082008
2008
Interest
Automotive sector ................................................................................................
.................
$ 1,336 $ 1,302 $ 1,948
Financial Services sector ................................................................
................................
4,018 5,572 7,662
Total interest paid ................................................................................................
...............
$ 5,354 $ 6,874 $ 9,610
Income taxes ................................................................................................
..........................
$ 73 $ (764) $ 553
NOTE 28. SEGMENT INFORMATION
Our operating activity consists of two operating sectors, Automotive and Financial Services. Segment selection is
based on the organizational structure we use to evaluate performance and make decisions on resource allocation, as well
as availability and materiality of separate financial results consistent with that structure.
Automotive Sector
In 2010, we changed the reporting structure of our Automotive sector to separately disclose the following four
segments: 1) Ford North America, 2) Ford South America, 3) Ford Europe, and 4) Ford Asia Pacific Africa. Included in
each segment, described below, are the associated costs to develop, manufacture, distribute, and service vehicles and
parts. Automotive sector prior period information includes three additional segments described below: 1) Mazda,
2) Volvo, and 3) Jaguar Land Rover.
Ford North America segment includes primarily the sale of Ford, Lincoln, and Mercury brand vehicles and related
service parts and accessories in North America (the United States, Canada and Mexico). From the first quarter of 2008,
until the sale of a portion of our investment in November 2008, the reporting structure of this segment included the sale of
Mazda6 vehicles by our consolidated subsidiary, AAI (previously included in the results for Ford Asia Pacific Africa).