Ford 2010 Annual Report Download - page 173
Download and view the complete annual report
Please find page 173 of the 2010 Ford annual report below. You can navigate through the pages in the report by either clicking on the pages listed below, or by using the keyword search tool below to find specific information within the annual report.-
 1
1 -
2
-
3
-
4
-
5
-
6
-
7
-
8
-
9
-
10
-
11
-
12
-
13
-
14
-
15
-
16
-
17
-
18
-
19
-
20
-
21
-
22
-
23
-
24
-
25
-
26
-
27
-
28
-
29
-
30
-
31
-
32
-
33
-
34
-
35
-
36
-
37
-
38
-
39
-
40
-
41
-
42
-
43
-
44
-
45
-
46
-
47
-
48
-
49
-
50
-
51
-
52
-
53
-
54
-
55
-
56
-
57
-
58
-
59
-
60
-
61
-
62
-
63
-
64
-
65
-
66
-
67
-
68
-
69
-
70
-
71
-
72
-
73
-
74
-
75
-
76
-
77
-
78
-
79
-
80
-
81
-
82
-
83
-
84
-
85
-
86
-
87
-
88
-
89
-
90
-
91
-
92
-
93
-
94
-
95
-
96
-
97
-
98
-
99
-
100
-
101
-
102
-
103
-
104
-
105
-
106
-
107
-
108
-
109
-
110
-
111
-
112
-
113
-
114
-
115
-
116
-
117
-
118
-
119
-
120
-
121
-
122
-
123
-
124
-
125
-
126
-
127
-
128
-
129
-
130
-
131
-
132
-
133
-
134
-
135
-
136
-
137
-
138
-
139
-
140
-
141
-
142
-
143
-
144
-
145
-
146
-
147
-
148
-
149
-
150
-
151
-
152
-
153
-
154
-
155
-
156
-
157
-
158
-
159
-
160
-
161
-
162
-
 163
163 -
 164
164 -
 165
165 -
 166
166 -
 167
167 -
 168
168 -
 169
169 -
 170
170 -
 171
171 -
 172
172 -
 173
173 -
 174
174 -
 175
175 -
 176
176 -
 177
177 -
 178
178 -
 179
179 -
 180
180 -
 181
181 -
 182
182 -
 183
183 -
184
 |
 |

Notes to the Financial Statements
Ford Motor Company | 2010 Annual Report 171
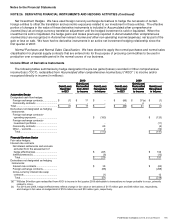
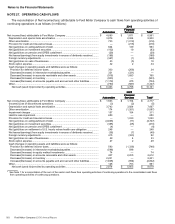
NOTE 28. SEGMENT INFORMATION (Continued)
(In millions)
(In millions)(In millions)
(In millions)
Automotive Sector
Automotive SectorAutomotive Sector
Automotive Sector
Operating Segments
Operating SegmentsOperating Segments
Operating Segments
Reconciling Items
Reconciling ItemsReconciling Items
Reconciling Items
2010
20102010
2010
Ford
Ford Ford
Ford
North
North North
North
America
AmericaAmerica
America
Ford
Ford Ford
Ford
South
South South
South
America
AmericaAmerica
America
Ford
Ford Ford
Ford
Europe
EuropeEurope
Europe
Ford
Ford Ford
Ford
Asia
Asia Asia
Asia
Pacific
Pacific Pacific
Pacific
Africa
AfricaAfrica
Africa
Volvo
VolvoVolvo
Volvo
Mazda
MazdaMazda
Mazda
Other
Other Other
Other
Automotive
AutomotiveAutomotive
Automotive
Special
Special Special
Special
Items
ItemsItems
Items
Total
TotalTotal
Total
Sales/Revenues
External customer ................................
..............
$ 64,428
$ 9,905
$ 29,486
$ 7,381
$ —
$ —
$ — $ 8,080
$119,280
Intersegment................................
......................
674
—
732
—
—
—
— 13
1,419
Income
Income/(Loss) before income taxes
...................
5,409
1,010
182
189
—
—
(1,493) (1,151)
4,146
Other disclosures:
Depreciation and special tools
amortization ................................
.......................
2,058
247
1,199
262
—
—
— 110
3,876
Amortization of intangibles
................................
9
77
—
1
—
—
— 10
97
Interest expense ................................
................
—
—
—
—
—
—
1,807 —
1,807
Interest income ................................
..................
47
—
—
—
—
—
215 —
262
Cash outflow for capital expenditures
................
2,127
364
971
467
—
—
— 137
4,066
Unconsolidated affiliates
Equity in net income/(loss)
................................
155
—
128
242
—
—
— 1
526
Total assets at year-end
................................
29,955
6,623
22,260
5,768
—
—
— —
64,606 (a)
2009
20092009
2009
Sales/Revenues
External customer
................................
$ 49,713
$ 7,947
$ 28,304
$ 5,548
$ 12,356
$ —
$ — $ —
$103,868
Intersegment ................................
....................
347
—
608
—
48
—
— —
1,003
Income
Income/(Loss) before income taxes
.................
(639)
765
(144)
(86)
(662)
—
(1,091) 2,642
785
Other disclosures:
Depreciation and special tools
amortization................................
....................
2,033
187
1,153
229
141
—
— —
3,743
Amortization of intangibles
...............................
10
68
—
1
7
—
— —
86
Interest expense................................
...............
—
—
—
—
—
—
1,477 —
1,477
Interest income................................
.................
55
—
—
—
—
—
150 —
205
Cash outflow for capital
expenditures................................
...................
2,374
300
742
215
412
—
— —
4,043
Unconsolidated affiliates
Equity in net income/(loss)
...........................
91
—
30
164
45
—
— —
330
Total assets at year-end (b)
.............................
79,118 (a)
2008
20082008
2008
Sales/Revenues
External customer
................................
$ 53,325
$ 8,648
$ 37,605
$ 6,515
$ 14,568
$ —
$ — $ 6,974
$127,635
Intersegment ................................
....................
677
—
761
—
99
—
— 63
1,600
Income
Income/(Loss) before income taxes
.................
(5,884)
1,230
644
(157)
(1,497)
230
(1,324) (5,556)
(12,314)
Other disclosures:
Depreciation and special tools
amortization................................
....................
2,664
193
1,414
254
685
—
15 5,606
10,831
Amortization of intangibles
...............................
7
77
7
1
7
—
— —
99
Interest expense................................
...............
—
—
—
—
—
—
1,993 —
1,993
Interest income................................
.................
61
—
—
—
—
—
867 —
928
Cash outflow for capital
expenditures................................
...................
3,718
217
1,480
321
532
—
148 —
6,416
Unconsolidated affiliates
Equity in net income/(loss)
...........................
121
—
130
107
(15)
25
— —
368
Total assets at year-end (b)
.............................
71,556
__________
(a) As reported on our sector balance sheet.
(b) Total assets by operating segment not available.