HSBC 2011 Annual Report Download - page 10
Download and view the complete annual report
Please find page 10 of the 2011 HSBC annual report below. You can navigate through the pages in the report by either clicking on the pages listed below, or by using the keyword search tool below to find specific information within the annual report.-
 1
1 -
 2
2 -
 3
3 -
 4
4 -
 5
5 -
 6
6 -
 7
7 -
 8
8 -
 9
9 -
 10
10 -
 11
11 -
 12
12 -
 13
13 -
 14
14 -
 15
15 -
 16
16 -
 17
17 -
 18
18 -
 19
19 -
 20
20 -
 21
21 -
22
-
23
-
24
-
25
-
26
-
27
-
28
-
29
-
30
-
31
-
32
-
33
-
34
-
35
-
36
-
37
-
38
-
39
-
40
-
41
-
42
-
43
-
44
-
45
-
46
-
47
-
48
-
49
-
50
-
51
-
52
-
53
-
54
-
55
-
56
-
57
-
58
-
59
-
60
-
61
-
62
-
63
-
64
-
65
-
66
-
67
-
68
-
69
-
70
-
71
-
72
-
73
-
74
-
75
-
76
-
77
-
78
-
79
-
80
-
81
-
82
-
83
-
84
-
85
-
86
-
87
-
88
-
89
-
90
-
91
-
92
-
93
-
94
-
95
-
96
-
97
-
98
-
99
-
100
-
101
-
102
-
103
-
104
-
105
-
106
-
107
-
108
-
109
-
110
-
111
-
112
-
113
-
114
-
115
-
116
-
117
-
118
-
119
-
120
-
121
-
122
-
123
-
124
-
125
-
126
-
127
-
128
-
129
-
130
-
131
-
132
-
133
-
134
-
135
-
136
-
137
-
138
-
139
-
140
-
141
-
142
-
143
-
144
-
145
-
146
-
147
-
148
-
149
-
150
-
151
-
152
-
153
-
154
-
155
-
156
-
157
-
158
-
159
-
160
-
161
-
162
-
163
-
164
-
165
-
166
-
167
-
168
-
169
-
170
-
171
-
172
-
173
-
174
-
175
-
176
-
177
-
178
-
179
-
180
-
181
-
182
-
183
-
184
-
185
-
186
-
187
-
188
-
189
-
190
-
191
-
192
-
193
-
194
-
195
-
196
-
197
-
198
-
199
-
200
-
201
-
202
-
203
-
204
-
205
-
206
-
207
-
208
-
209
-
210
-
211
-
212
-
213
-
214
-
215
-
216
-
217
-
218
-
219
-
220
-
221
-
222
-
223
-
224
-
225
-
226
-
227
-
228
-
229
-
230
-
231
-
232
-
233
-
234
-
235
-
236
-
237
-
238
-
239
-
240
-
241
-
242
-
243
-
244
-
245
-
246
-
247
-
248
-
249
-
250
-
251
-
252
-
253
-
254
-
255
-
256
-
257
-
258
-
259
-
260
-
261
-
262
-
263
-
264
-
265
-
266
-
267
-
268
-
269
-
270
-
271
-
272
-
273
-
274
-
275
-
276
-
277
-
278
-
279
-
280
-
281
-
282
-
283
-
284
-
285
-
286
-
287
-
288
-
289
-
290
-
291
-
292
-
293
-
294
-
295
-
296
-
297
-
298
-
299
-
300
-
301
-
302
-
303
-
304
-
305
-
306
-
307
-
308
-
309
-
310
-
311
-
312
-
313
-
314
-
315
-
316
-
317
-
318
-
319
-
320
-
321
-
322
-
323
-
324
-
325
-
326
-
327
-
328
-
329
-
330
-
331
-
332
-
333
-
334
-
335
-
336
-
337
-
338
-
339
-
340
-
341
-
342
-
343
-
344
-
345
-
346
-
347
-
348
-
349
-
350
-
351
-
352
-
353
-
354
-
355
-
356
-
357
-
358
-
359
-
360
-
361
-
362
-
363
-
364
-
365
-
366
-
367
-
368
-
369
-
370
-
371
-
372
-
373
-
374
-
375
-
376
-
377
-
378
-
379
-
380
-
381
-
382
-
383
-
384
-
385
-
386
-
387
-
388
-
389
-
390
-
391
-
392
-
393
-
394
-
395
-
396
-
397
-
398
-
399
-
400
-
401
-
402
-
403
-
404
-
405
-
406
-
407
-
408
-
409
-
410
-
411
-
412
-
413
-
414
-
415
-
416
-
417
-
418
-
419
-
420
-
421
-
422
-
423
-
424
-
425
-
426
-
427
-
428
-
429
-
430
-
431
-
432
-
433
-
434
-
435
-
436
-
437
-
438
-
439
-
440
 |
 |

HSBC HOLDINGS PLC
Report of the Directors: Overview (continued)
Group Chief Executive’s Business Review
8
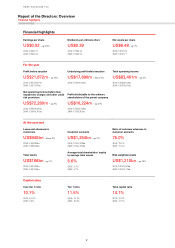
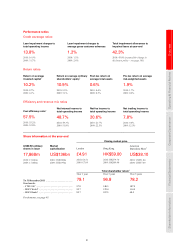
• Costs rose by 10%, reflecting wage inflation
in key markets and higher average full-time
equivalent employee numbers for the year
(although numbers have fallen since the first
quarter), as well as an increase in significant
items. These included restructuring costs
(including the impairment of certain intangible
assets) of US$1.1bn, UK customer redress
programmes of US$898m and a bank levy
introduced by the UK Government of
US$570m, partly offset by a UK pension credit
of US$587m. The rise in costs was partially
offset by US$0.9bn in sustainable cost savings
achieved so far in executing our strategy.
• As a result of these factors, the cost efficiency
ratio worsened from 55.2% to 57.5% on a
reported basis, and from 55.6% to 61.0% on an
underlying basis.
• Our results continue to be adversely affected by
the losses in the US consumer finance business,
which, on an underlying basis, were US$2.4bn
and US$2.2bn in 2011 and 2010, respectively.
We have agreed the sale of the profitable US
Card and Retail Services portfolio with the
remainder of the loss-making US consumer
finance business being run down.
• Return on average ordinary shareholders’ equity
was 10.9%, up from 9.5% in 2010, reflecting the
favourable movement on the fair value of our
own debt.
• The Group’s pre-tax return on risk-weighted
assets (‘RoRWA’) for 2011 was 1.9%, or 1.5%
on an underlying basis. Adjusting for negative
returns on US consumer finance business and
legacy credit in Global Banking and Markets,
the remainder of the Group achieved a RoRWA
of 2.2% in 2011 and 2.3% in 2010.
• Dividends declared in respect of 2011 totalled
US$7.3bn, or US$0.41 per ordinary share,
an increase of 14%, with a fourth interim
dividend for 2011 of US$0.14 per ordinary
share.
• The core tier 1 ratio was 10.1% at 31 December
2011, down from 10.5% at 31 December 2010,
reflecting an increase in risk-weighted assets
(‘RWA’s) due to the introduction of Basel 2.5 in
Global Banking and Markets and growth in
lending balances including those classified as
held for sale. The growth in RWAs was notably
in Commercial Banking, which included an
increase in the RWAs of our mainland China
associates.
• Profit attributable to ordinary shareholders
increased by 27% to US$16.2bn, of which
US$7.3bn was declared in dividends in respect
of the year. This compared with US$3.4bn of
variable pay awarded (net of tax) to our
employees for 2011.
Progress on strategy
There are two major trends which are key to HSBC’s
future: the continuing growth of international trade
and capital flows; and wealth creation, particularly in
faster-growing markets. In May, we defined a new
strategy for the Group to capitalise on these trends
and connect customers to opportunities by building
on our distinctive presence in the network of markets
which generate the major trade and capital flows,
capturing wealth creation in target markets and
focusing on retail banking only where we can
achieve profitable scale.
In a difficult operating environment this strategy
is key to improving our performance and we remain
focused on delivering our targets of a return on
average shareholders’ equity of 12-15% and a cost
efficiency ratio of 48-52% by the end of 2013. We
are executing the strategy by deploying capital more
effectively, implementing measures to improve our
cost efficiency and positioning the business for
growth. We have made significant progress in all of
these three areas.
First, to ensure effective deployment of capital,
we undertook a Group-wide review of our business,
testing each part of the portfolio against our five
filters framework. This looks at the strategic
relevance of each country, and each business in each
country, assessing their connectivity, economic
development, profitability, cost efficiency and
liquidity. As a result, we announced 16 disposals or
closures in 2011 and a further three in 2012,
including two large transactions in the US, the
withdrawal from Georgia and the exit of Retail
Banking and Wealth Management operations in
Russia, Chile, Thailand and Poland. When
completed, these disposals and closures should
represent a reduction of around US$50bn of risk-
weighted assets and the transfer to the acquirers of
approximately 12,000 full-time equivalent
employees. We are continuing this process in 2012
and have identified a number of further transactions.
Second, to improve cost efficiency we achieved
US$0.9bn of sustainable savings. Our programmes
to implement consistent business models and
restructure global businesses and global functions
progressed well. We are creating a leaner Group,
removing layers of management to give staff greater