HSBC 2011 Annual Report Download - page 382
Download and view the complete annual report
Please find page 382 of the 2011 HSBC annual report below. You can navigate through the pages in the report by either clicking on the pages listed below, or by using the keyword search tool below to find specific information within the annual report.-
 1
1 -
2
-
3
-
4
-
5
-
6
-
7
-
8
-
9
-
10
-
11
-
12
-
13
-
14
-
15
-
16
-
17
-
18
-
19
-
20
-
21
-
22
-
23
-
24
-
25
-
26
-
27
-
28
-
29
-
30
-
31
-
32
-
33
-
34
-
35
-
36
-
37
-
38
-
39
-
40
-
41
-
42
-
43
-
44
-
45
-
46
-
47
-
48
-
49
-
50
-
51
-
52
-
53
-
54
-
55
-
56
-
57
-
58
-
59
-
60
-
61
-
62
-
63
-
64
-
65
-
66
-
67
-
68
-
69
-
70
-
71
-
72
-
73
-
74
-
75
-
76
-
77
-
78
-
79
-
80
-
81
-
82
-
83
-
84
-
85
-
86
-
87
-
88
-
89
-
90
-
91
-
92
-
93
-
94
-
95
-
96
-
97
-
98
-
99
-
100
-
101
-
102
-
103
-
104
-
105
-
106
-
107
-
108
-
109
-
110
-
111
-
112
-
113
-
114
-
115
-
116
-
117
-
118
-
119
-
120
-
121
-
122
-
123
-
124
-
125
-
126
-
127
-
128
-
129
-
130
-
131
-
132
-
133
-
134
-
135
-
136
-
137
-
138
-
139
-
140
-
141
-
142
-
143
-
144
-
145
-
146
-
147
-
148
-
149
-
150
-
151
-
152
-
153
-
154
-
155
-
156
-
157
-
158
-
159
-
160
-
161
-
162
-
163
-
164
-
165
-
166
-
167
-
168
-
169
-
170
-
171
-
172
-
173
-
174
-
175
-
176
-
177
-
178
-
179
-
180
-
181
-
182
-
183
-
184
-
185
-
186
-
187
-
188
-
189
-
190
-
191
-
192
-
193
-
194
-
195
-
196
-
197
-
198
-
199
-
200
-
201
-
202
-
203
-
204
-
205
-
206
-
207
-
208
-
209
-
210
-
211
-
212
-
213
-
214
-
215
-
216
-
217
-
218
-
219
-
220
-
221
-
222
-
223
-
224
-
225
-
226
-
227
-
228
-
229
-
230
-
231
-
232
-
233
-
234
-
235
-
236
-
237
-
238
-
239
-
240
-
241
-
242
-
243
-
244
-
245
-
246
-
247
-
248
-
249
-
250
-
251
-
252
-
253
-
254
-
255
-
256
-
257
-
258
-
259
-
260
-
261
-
262
-
263
-
264
-
265
-
266
-
267
-
268
-
269
-
270
-
271
-
272
-
273
-
274
-
275
-
276
-
277
-
278
-
279
-
280
-
281
-
282
-
283
-
284
-
285
-
286
-
287
-
288
-
289
-
290
-
291
-
292
-
293
-
294
-
295
-
296
-
297
-
298
-
299
-
300
-
301
-
302
-
303
-
304
-
305
-
306
-
307
-
308
-
309
-
310
-
311
-
312
-
313
-
314
-
315
-
316
-
317
-
318
-
319
-
320
-
321
-
322
-
323
-
324
-
325
-
326
-
327
-
328
-
329
-
330
-
331
-
332
-
333
-
334
-
335
-
336
-
337
-
338
-
339
-
340
-
341
-
342
-
343
-
344
-
345
-
346
-
347
-
348
-
349
-
350
-
351
-
352
-
353
-
354
-
355
-
356
-
357
-
358
-
359
-
360
-
361
-
362
-
363
-
364
-
365
-
366
-
367
-
368
-
369
-
370
-
371
-
 372
372 -
 373
373 -
 374
374 -
 375
375 -
 376
376 -
 377
377 -
 378
378 -
 379
379 -
 380
380 -
 381
381 -
 382
382 -
 383
383 -
 384
384 -
 385
385 -
 386
386 -
 387
387 -
 388
388 -
 389
389 -
 390
390 -
 391
391 -
 392
392 -
393
-
394
-
395
-
396
-
397
-
398
-
399
-
400
-
401
-
402
-
403
-
404
-
405
-
406
-
407
-
408
-
409
-
410
-
411
-
412
-
413
-
414
-
415
-
416
-
417
-
418
-
419
-
420
-
421
-
422
-
423
-
424
-
425
-
426
-
427
-
428
-
429
-
430
-
431
-
432
-
433
-
434
-
435
-
436
-
437
-
438
-
439
-
440
 |
 |

HSBC HOLDINGS PLC
Notes on the Financial Statements (continued)
27 – Assets held for sale and other assets / 28 – Trading liabilities / 29 – Financial liabilities at FV / 30 – Debt securities in issue
380
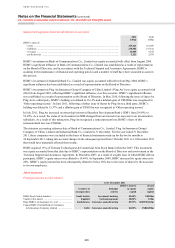
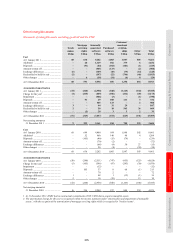
The major classes of assets and associated liabilities of disposal groups held for sale were as follows:
31 December 2011
Costa Rica,
El Salvador
and
Honduras
US
branches
US Card
and Retail
Services Other Total
US$m US$m US$m US$m US$m
Assets of disposal groups held for sale
Trading assets ............................................................... 3 – – 295 298
Loans and advances to banks ....................................... 548 – – 6 554
Loans and advances to customers ................................ 2,506 2,441 29,137 1,021 35,105
Financial investments ................................................... 482 – – – 482
Prepayments and accrued income ................................ 28 10 582 6 626
Goodwill and intangible assets ..................................... 256 10 318 1 585
Other assets of disposal groups .................................... 512 60 621 60 1,253
Total assets .................................................................... 4,335 2,521 30,658 1,389 38,903
Liabilities of disposal groups held for sale (Note 31)
Deposits by banks ......................................................... 206 – – – 206
Customer accounts ........................................................ 2,828 15,144 – 2,166 20,138
Trading liabilities .......................................................... – – – 803 803
Debt securities in issue ................................................. 152 – – 149 301
Other liabilities of disposal groups ............................... 196 12 470 74 752
Total liabilities .............................................................. 3,382 15,156 470 3,192 22,200
Net unrealised gains/(losses) recognised in
‘other operating income’ after reclassification
to held for sale .......................................................... – – – (7) (7)
Expected date of completion ........................................ Q4 2012 Q3 2012 Q2 2012
Operating segment......................................................... Latin
America
North
America
North
America
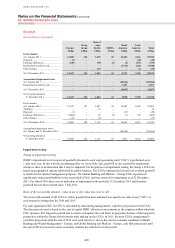
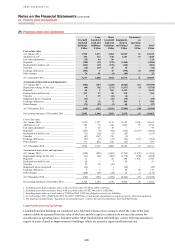
Property, plant and equipment
The property, plant and equipment classified as held for sale is the result of repossession of property that had been
pledged as collateral by customers. Substantially all of these assets are disposed of within 12 months of acquisition.
The majority arose within the North America operating segment.
Neither a gain nor loss was recognised on reclassifying the disposal groups or non-current assets as held for sale
during the year.
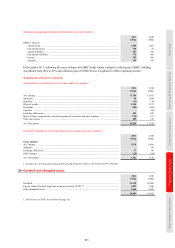
Other assets
2011 2010
US$m US$m
Bullion ...................................................................................................................................................... 19,824 18,446
Reinsurers’ share of liabilities under insurance contracts (Note 32) ....................................................... 1,801 1,865
Endorsements and acceptances ................................................................................................................. 11,010 10,116
Retirement benefit assets .......................................................................................................................... 2,497 43
Other accounts .......................................................................................................................................... 13,567 10,790
48,699 41,260