HSBC 2011 Annual Report Download - page 363
Download and view the complete annual report
Please find page 363 of the 2011 HSBC annual report below. You can navigate through the pages in the report by either clicking on the pages listed below, or by using the keyword search tool below to find specific information within the annual report.-
 1
1 -
2
-
3
-
4
-
5
-
6
-
7
-
8
-
9
-
10
-
11
-
12
-
13
-
14
-
15
-
16
-
17
-
18
-
19
-
20
-
21
-
22
-
23
-
24
-
25
-
26
-
27
-
28
-
29
-
30
-
31
-
32
-
33
-
34
-
35
-
36
-
37
-
38
-
39
-
40
-
41
-
42
-
43
-
44
-
45
-
46
-
47
-
48
-
49
-
50
-
51
-
52
-
53
-
54
-
55
-
56
-
57
-
58
-
59
-
60
-
61
-
62
-
63
-
64
-
65
-
66
-
67
-
68
-
69
-
70
-
71
-
72
-
73
-
74
-
75
-
76
-
77
-
78
-
79
-
80
-
81
-
82
-
83
-
84
-
85
-
86
-
87
-
88
-
89
-
90
-
91
-
92
-
93
-
94
-
95
-
96
-
97
-
98
-
99
-
100
-
101
-
102
-
103
-
104
-
105
-
106
-
107
-
108
-
109
-
110
-
111
-
112
-
113
-
114
-
115
-
116
-
117
-
118
-
119
-
120
-
121
-
122
-
123
-
124
-
125
-
126
-
127
-
128
-
129
-
130
-
131
-
132
-
133
-
134
-
135
-
136
-
137
-
138
-
139
-
140
-
141
-
142
-
143
-
144
-
145
-
146
-
147
-
148
-
149
-
150
-
151
-
152
-
153
-
154
-
155
-
156
-
157
-
158
-
159
-
160
-
161
-
162
-
163
-
164
-
165
-
166
-
167
-
168
-
169
-
170
-
171
-
172
-
173
-
174
-
175
-
176
-
177
-
178
-
179
-
180
-
181
-
182
-
183
-
184
-
185
-
186
-
187
-
188
-
189
-
190
-
191
-
192
-
193
-
194
-
195
-
196
-
197
-
198
-
199
-
200
-
201
-
202
-
203
-
204
-
205
-
206
-
207
-
208
-
209
-
210
-
211
-
212
-
213
-
214
-
215
-
216
-
217
-
218
-
219
-
220
-
221
-
222
-
223
-
224
-
225
-
226
-
227
-
228
-
229
-
230
-
231
-
232
-
233
-
234
-
235
-
236
-
237
-
238
-
239
-
240
-
241
-
242
-
243
-
244
-
245
-
246
-
247
-
248
-
249
-
250
-
251
-
252
-
253
-
254
-
255
-
256
-
257
-
258
-
259
-
260
-
261
-
262
-
263
-
264
-
265
-
266
-
267
-
268
-
269
-
270
-
271
-
272
-
273
-
274
-
275
-
276
-
277
-
278
-
279
-
280
-
281
-
282
-
283
-
284
-
285
-
286
-
287
-
288
-
289
-
290
-
291
-
292
-
293
-
294
-
295
-
296
-
297
-
298
-
299
-
300
-
301
-
302
-
303
-
304
-
305
-
306
-
307
-
308
-
309
-
310
-
311
-
312
-
313
-
314
-
315
-
316
-
317
-
318
-
319
-
320
-
321
-
322
-
323
-
324
-
325
-
326
-
327
-
328
-
329
-
330
-
331
-
332
-
333
-
334
-
335
-
336
-
337
-
338
-
339
-
340
-
341
-
342
-
343
-
344
-
345
-
346
-
347
-
348
-
349
-
350
-
351
-
352
-
 353
353 -
 354
354 -
 355
355 -
 356
356 -
 357
357 -
 358
358 -
 359
359 -
 360
360 -
 361
361 -
 362
362 -
 363
363 -
 364
364 -
 365
365 -
 366
366 -
 367
367 -
 368
368 -
 369
369 -
 370
370 -
 371
371 -
 372
372 -
 373
373 -
374
-
375
-
376
-
377
-
378
-
379
-
380
-
381
-
382
-
383
-
384
-
385
-
386
-
387
-
388
-
389
-
390
-
391
-
392
-
393
-
394
-
395
-
396
-
397
-
398
-
399
-
400
-
401
-
402
-
403
-
404
-
405
-
406
-
407
-
408
-
409
-
410
-
411
-
412
-
413
-
414
-
415
-
416
-
417
-
418
-
419
-
420
-
421
-
422
-
423
-
424
-
425
-
426
-
427
-
428
-
429
-
430
-
431
-
432
-
433
-
434
-
435
-
436
-
437
-
438
-
439
-
440
 |
 |

361
Overview Operating & Financial Review Corporate Governance Financial Statements Shareholder Information
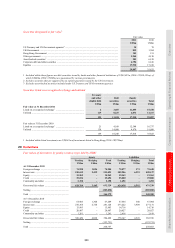
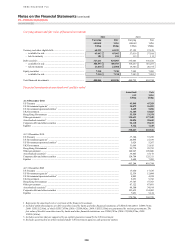
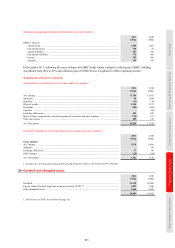
Securities designated at fair value1
Fair value
2011 2010
US$m US$m
US Treasury and US Government agencies2 ........................................................................................... 35 78
UK Government ....................................................................................................................................... 812 1,304
Hong Kong Government ......................................................................................................................... 151 151
Other government .................................................................................................................................... 3,964 4,130
Asset-backed securities3 .......................................................................................................................... 201 6,128
Corporate debt and other securities ......................................................................................................... 6,794 6,616
Equities .................................................................................................................................................... 17,930 17,418
29,887 35,825
1 Included within these figures are debt securities issued by banks and other financial institutions of US$3,497m (2010: US$10,185m), of
which US$40m (2010: US$48m) are guaranteed by various governments.
2 Includes securities that are supported by an explicit guarantee issued by the US Government.
3 Excludes asset-backed securities included under US Treasury and US Government agencies.
Securities listed on a recognised exchange and unlisted
Treasury
and other
eligible bills
Debt
securities
Equity
securities
Total
US$m US$m US$m US$m
Fair value at 31 December 2011
Listed on a recognised exchange1 ................................................ 4 3,607 11,859 15,470
Unlisted ......................................................................................... 119 8,227 6,071 14,417
123 11,834 17,930 29,887
Fair value at 31 December 2010
Listed on a recognised exchange1 ................................................ 21 4,168 12,548 16,737
Unlisted ......................................................................................... 138 14,080 4,870 19,088
159 18,248 17,418 35,825
1 Included within listed investments are US$631m of investments listed in Hong Kong (2010: US$756m).
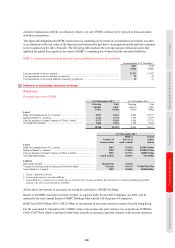
20 Derivatives
Fair values of derivatives by product contract type held by HSBC
Assets Liabilities
Trading Hedging Total Trading Hedging Total
US$m US$m US$m US$m US$m US$m
At 31 December 2011
Foreign exchange ................................................ 74,958 1,026 75,984 75,077 371 75,448
Interest rate ......................................................... 510,652 2,439 513,091 502,906 6,221 509,127
Equity .................................................................. 15,262 – 15,262 19,363 – 19,363
Credit .................................................................. 25,694 – 25,694 25,800 – 25,800
Commodity and other ......................................... 2,198 – 2,198 1,492 – 1,492
Gross total fair values ......................................... 628,764 3,465 632,229 624,638 6,592 631,230
Netting ................................................................ (285,850) (285,850)
Total .................................................................... 346,379 345,380
At 31 December 2010
Foreign exchange ................................................ 65,905 1,304 67,209 67,564 340 67,904
Interest rate ......................................................... 278,364 2,764 281,128 273,222 3,909 277,131
Equity .................................................................. 13,983 – 13,983 14,716 – 14,716
Credit .................................................................. 20,907 – 20,907 20,027 – 20,027
Commodity and other ......................................... 1,261 – 1,261 2,618 – 2,618
Gross total fair values ......................................... 380,420 4,068 384,488 378,147 4,249 382,396
Netting ................................................................ (123,731) (123,731)
Total .................................................................... 260,757 258,665