HSBC 2011 Annual Report Download - page 5
Download and view the complete annual report
Please find page 5 of the 2011 HSBC annual report below. You can navigate through the pages in the report by either clicking on the pages listed below, or by using the keyword search tool below to find specific information within the annual report.-
 1
1 -
 2
2 -
 3
3 -
 4
4 -
 5
5 -
 6
6 -
 7
7 -
 8
8 -
 9
9 -
 10
10 -
 11
11 -
 12
12 -
 13
13 -
 14
14 -
 15
15 -
 16
16 -
17
-
18
-
19
-
20
-
21
-
22
-
23
-
24
-
25
-
26
-
27
-
28
-
29
-
30
-
31
-
32
-
33
-
34
-
35
-
36
-
37
-
38
-
39
-
40
-
41
-
42
-
43
-
44
-
45
-
46
-
47
-
48
-
49
-
50
-
51
-
52
-
53
-
54
-
55
-
56
-
57
-
58
-
59
-
60
-
61
-
62
-
63
-
64
-
65
-
66
-
67
-
68
-
69
-
70
-
71
-
72
-
73
-
74
-
75
-
76
-
77
-
78
-
79
-
80
-
81
-
82
-
83
-
84
-
85
-
86
-
87
-
88
-
89
-
90
-
91
-
92
-
93
-
94
-
95
-
96
-
97
-
98
-
99
-
100
-
101
-
102
-
103
-
104
-
105
-
106
-
107
-
108
-
109
-
110
-
111
-
112
-
113
-
114
-
115
-
116
-
117
-
118
-
119
-
120
-
121
-
122
-
123
-
124
-
125
-
126
-
127
-
128
-
129
-
130
-
131
-
132
-
133
-
134
-
135
-
136
-
137
-
138
-
139
-
140
-
141
-
142
-
143
-
144
-
145
-
146
-
147
-
148
-
149
-
150
-
151
-
152
-
153
-
154
-
155
-
156
-
157
-
158
-
159
-
160
-
161
-
162
-
163
-
164
-
165
-
166
-
167
-
168
-
169
-
170
-
171
-
172
-
173
-
174
-
175
-
176
-
177
-
178
-
179
-
180
-
181
-
182
-
183
-
184
-
185
-
186
-
187
-
188
-
189
-
190
-
191
-
192
-
193
-
194
-
195
-
196
-
197
-
198
-
199
-
200
-
201
-
202
-
203
-
204
-
205
-
206
-
207
-
208
-
209
-
210
-
211
-
212
-
213
-
214
-
215
-
216
-
217
-
218
-
219
-
220
-
221
-
222
-
223
-
224
-
225
-
226
-
227
-
228
-
229
-
230
-
231
-
232
-
233
-
234
-
235
-
236
-
237
-
238
-
239
-
240
-
241
-
242
-
243
-
244
-
245
-
246
-
247
-
248
-
249
-
250
-
251
-
252
-
253
-
254
-
255
-
256
-
257
-
258
-
259
-
260
-
261
-
262
-
263
-
264
-
265
-
266
-
267
-
268
-
269
-
270
-
271
-
272
-
273
-
274
-
275
-
276
-
277
-
278
-
279
-
280
-
281
-
282
-
283
-
284
-
285
-
286
-
287
-
288
-
289
-
290
-
291
-
292
-
293
-
294
-
295
-
296
-
297
-
298
-
299
-
300
-
301
-
302
-
303
-
304
-
305
-
306
-
307
-
308
-
309
-
310
-
311
-
312
-
313
-
314
-
315
-
316
-
317
-
318
-
319
-
320
-
321
-
322
-
323
-
324
-
325
-
326
-
327
-
328
-
329
-
330
-
331
-
332
-
333
-
334
-
335
-
336
-
337
-
338
-
339
-
340
-
341
-
342
-
343
-
344
-
345
-
346
-
347
-
348
-
349
-
350
-
351
-
352
-
353
-
354
-
355
-
356
-
357
-
358
-
359
-
360
-
361
-
362
-
363
-
364
-
365
-
366
-
367
-
368
-
369
-
370
-
371
-
372
-
373
-
374
-
375
-
376
-
377
-
378
-
379
-
380
-
381
-
382
-
383
-
384
-
385
-
386
-
387
-
388
-
389
-
390
-
391
-
392
-
393
-
394
-
395
-
396
-
397
-
398
-
399
-
400
-
401
-
402
-
403
-
404
-
405
-
406
-
407
-
408
-
409
-
410
-
411
-
412
-
413
-
414
-
415
-
416
-
417
-
418
-
419
-
420
-
421
-
422
-
423
-
424
-
425
-
426
-
427
-
428
-
429
-
430
-
431
-
432
-
433
-
434
-
435
-
436
-
437
-
438
-
439
-
440
 |
 |

3
Overview Operating & Financial Review Corporate Governance Financial Statements Shareholder Information
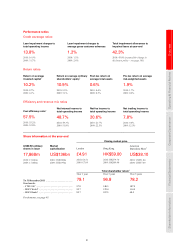
Performance ratios
Credit coverage ratios
Loan impairment charges to
total operating income
13.8%
2010: 16.9%
2009: 31.7%
Loan impairment charges to
average gross customer advances
1.2%
2010: 1.5%
2009: 2.8%
Total impairment allowances to
impaired loans at year-end
42.3%
2010: 43.0% (restated for change in
disclosure policy – see page 105)
Return ratios
Return on average
invested capital2
10.2%
2010: 8.7%
2009: 4.1%
Return on average ordinary
shareholders’ equity3
10.9%
2010: 9.5%
2009: 5.1%
Post-tax return on
average total assets
0.6%
2010: 0.6%
2009: 0.3%
Pre-tax return on average
risk-weighted assets
1.9%
2010: 1.7%
2009: 0.6%
Efficiency and revenue mix ratios
Cost efficiency ratio4
57.5%
2010: 55.2%
2009: 52.0%
Net interest income to
total operating income
48.7%
2010: 49.3%
2009: 51.8%
Net fee income to
total operating income
20.6%
2010: 21.7%
2009: 22.5%
Net trading income to
total operating income
7.8%
2010: 9.0%
2009: 12.5%
Share information at the year-end
Closing market price
US$0.50 ordinary
shares in issue
17,868m
2010: 17,686m
2009: 17,408m
Market
capitalisation
US$136bn
2010: US$180bn
2009: US$199bn
London
£4.91
2010: £6.51
2009: £7.09
Hong Kong
HK$59.00
2010: HK$79.70
2009: HK$89.40
American
Depositary Share5
US$38.10
2010: US$51.04
2009: US$57.09
Total shareholder return6
Over 1 year Over 3 years Over 5 years
To 31 December 2011 .............................................. 79.1 96.8 78.2
Benchmarks:
– FTSE 1007 ............................................................... 97.8 140.3 107.9
– MSCI World7 .......................................................... 95.7 129.4 114.9
– MSCI Banks7 .......................................................... 82.7 107.5 60.5
For footnotes, see page 95.