HSBC 2011 Annual Report Download - page 379
Download and view the complete annual report
Please find page 379 of the 2011 HSBC annual report below. You can navigate through the pages in the report by either clicking on the pages listed below, or by using the keyword search tool below to find specific information within the annual report.-
 1
1 -
2
-
3
-
4
-
5
-
6
-
7
-
8
-
9
-
10
-
11
-
12
-
13
-
14
-
15
-
16
-
17
-
18
-
19
-
20
-
21
-
22
-
23
-
24
-
25
-
26
-
27
-
28
-
29
-
30
-
31
-
32
-
33
-
34
-
35
-
36
-
37
-
38
-
39
-
40
-
41
-
42
-
43
-
44
-
45
-
46
-
47
-
48
-
49
-
50
-
51
-
52
-
53
-
54
-
55
-
56
-
57
-
58
-
59
-
60
-
61
-
62
-
63
-
64
-
65
-
66
-
67
-
68
-
69
-
70
-
71
-
72
-
73
-
74
-
75
-
76
-
77
-
78
-
79
-
80
-
81
-
82
-
83
-
84
-
85
-
86
-
87
-
88
-
89
-
90
-
91
-
92
-
93
-
94
-
95
-
96
-
97
-
98
-
99
-
100
-
101
-
102
-
103
-
104
-
105
-
106
-
107
-
108
-
109
-
110
-
111
-
112
-
113
-
114
-
115
-
116
-
117
-
118
-
119
-
120
-
121
-
122
-
123
-
124
-
125
-
126
-
127
-
128
-
129
-
130
-
131
-
132
-
133
-
134
-
135
-
136
-
137
-
138
-
139
-
140
-
141
-
142
-
143
-
144
-
145
-
146
-
147
-
148
-
149
-
150
-
151
-
152
-
153
-
154
-
155
-
156
-
157
-
158
-
159
-
160
-
161
-
162
-
163
-
164
-
165
-
166
-
167
-
168
-
169
-
170
-
171
-
172
-
173
-
174
-
175
-
176
-
177
-
178
-
179
-
180
-
181
-
182
-
183
-
184
-
185
-
186
-
187
-
188
-
189
-
190
-
191
-
192
-
193
-
194
-
195
-
196
-
197
-
198
-
199
-
200
-
201
-
202
-
203
-
204
-
205
-
206
-
207
-
208
-
209
-
210
-
211
-
212
-
213
-
214
-
215
-
216
-
217
-
218
-
219
-
220
-
221
-
222
-
223
-
224
-
225
-
226
-
227
-
228
-
229
-
230
-
231
-
232
-
233
-
234
-
235
-
236
-
237
-
238
-
239
-
240
-
241
-
242
-
243
-
244
-
245
-
246
-
247
-
248
-
249
-
250
-
251
-
252
-
253
-
254
-
255
-
256
-
257
-
258
-
259
-
260
-
261
-
262
-
263
-
264
-
265
-
266
-
267
-
268
-
269
-
270
-
271
-
272
-
273
-
274
-
275
-
276
-
277
-
278
-
279
-
280
-
281
-
282
-
283
-
284
-
285
-
286
-
287
-
288
-
289
-
290
-
291
-
292
-
293
-
294
-
295
-
296
-
297
-
298
-
299
-
300
-
301
-
302
-
303
-
304
-
305
-
306
-
307
-
308
-
309
-
310
-
311
-
312
-
313
-
314
-
315
-
316
-
317
-
318
-
319
-
320
-
321
-
322
-
323
-
324
-
325
-
326
-
327
-
328
-
329
-
330
-
331
-
332
-
333
-
334
-
335
-
336
-
337
-
338
-
339
-
340
-
341
-
342
-
343
-
344
-
345
-
346
-
347
-
348
-
349
-
350
-
351
-
352
-
353
-
354
-
355
-
356
-
357
-
358
-
359
-
360
-
361
-
362
-
363
-
364
-
365
-
366
-
367
-
368
-
 369
369 -
 370
370 -
 371
371 -
 372
372 -
 373
373 -
 374
374 -
 375
375 -
 376
376 -
 377
377 -
 378
378 -
 379
379 -
 380
380 -
 381
381 -
 382
382 -
 383
383 -
 384
384 -
 385
385 -
 386
386 -
 387
387 -
 388
388 -
 389
389 -
390
-
391
-
392
-
393
-
394
-
395
-
396
-
397
-
398
-
399
-
400
-
401
-
402
-
403
-
404
-
405
-
406
-
407
-
408
-
409
-
410
-
411
-
412
-
413
-
414
-
415
-
416
-
417
-
418
-
419
-
420
-
421
-
422
-
423
-
424
-
425
-
426
-
427
-
428
-
429
-
430
-
431
-
432
-
433
-
434
-
435
-
436
-
437
-
438
-
439
-
440
 |
 |

377
Overview Operating & Financial Review Corporate Governance Financial Statements Shareholder Information
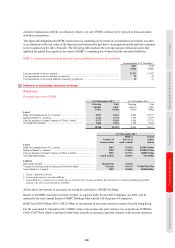
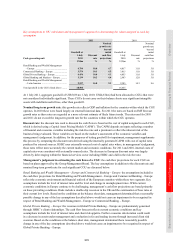
Leasehold land and buildings
2011 2010
Cost
Accumulated
depreciation Cost
Accumulated
depreciation
US$m US$m US$m US$m
At 1 January .................................................................................. 1,944 (933) 1,824 (831)
Additions ...................................................................................... 171 – 181 –
Disposals ....................................................................................... (269) 262 (81) 54
Depreciation charge for the year .................................................. – (139) – (133)
Impairment loss recognised .......................................................... – (15) – –
Exchange differences .................................................................... (13) 2 (16) –
Reclassified as held for sale ......................................................... (154) 73
Other changes ............................................................................... (10) (1) 36 (23)
At 31 December ............................................................................ 1,669 (751) 1,944 (933)
Net carrying amount at 31 December ........................................... 918 1,011
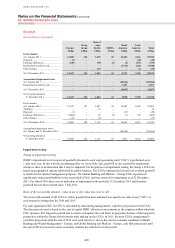
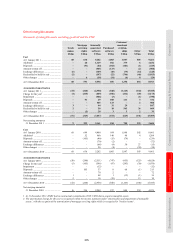
Investment properties
Movement on the fair value of investment properties
Freehold
land and
buildings
Long
leasehold
land and
buildings
Short
leasehold
land and
buildings
Total
US$m US$m US$m US$m
Fair value
At 1 January 2011 ......................................................................... 667 156 310 1,133
Additions at cost ........................................................................... 242 – – 242
Fair value adjustments .................................................................. (15) 44 89 118
Disposals ....................................................................................... (47) (17) – (64)
Exchange differences .................................................................... (22) 1 1 (20)
Other changes ............................................................................... (80) 8 2 (70)
At 31 December 2011 ................................................................... 745 192 402 1,339
Fair value
At 1 January 2010 ......................................................................... 640 184 237 1,061
Additions at cost ........................................................................... 240 – – 240
Fair value adjustments .................................................................. 31 24 38 93
Disposals ....................................................................................... (216) (2) – (218)
Transfers ....................................................................................... – (42) 42 –
Exchange differences .................................................................... (34) (1) (1) (36)
Other changes ............................................................................... 6 (7) (6) (7)
At 31 December 2010 ................................................................... 667 156 310 1,133
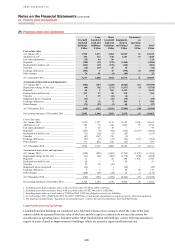
Investment properties are valued on a market value basis as at 31 December each year by independent professional
valuers who have recent experience in the location and type of properties. Investment properties in Hong Kong, the
Macau Special Administrative Region and mainland China, which represent more than 44% by value of HSBC’s
investment properties subject to revaluation, were valued by DTZ Debenham Tie Leung Limited whose valuers are
members of the Hong Kong Institute of Surveyors. Properties in other countries, which represent 56% by value of
HSBC’s investment properties, were valued by different independent professionally qualified valuers.
HSBC Holdings had no investment properties at 31 December 2011 or 2010.
HSBC properties leased to customers
HSBC properties leased to customers included US$618m at 31 December 2011 (2010: US$441m) let under operating
leases, net of accumulated depreciation of US$12m (2010: US$19m). None was held by HSBC Holdings.
At 31 December 2011, the classification of land and buildings in Hong Kong in accordance with Hong Kong
Companies Ordinance requirements was freehold nil (2010: nil), long leasehold US$1,363m (2010: US$1,292m),
medium leasehold US$1,484m (2010: US$1,436m) and short leasehold US$4m (2010: US$6m).