HSBC 2011 Annual Report Download - page 362
Download and view the complete annual report
Please find page 362 of the 2011 HSBC annual report below. You can navigate through the pages in the report by either clicking on the pages listed below, or by using the keyword search tool below to find specific information within the annual report.-
 1
1 -
2
-
3
-
4
-
5
-
6
-
7
-
8
-
9
-
10
-
11
-
12
-
13
-
14
-
15
-
16
-
17
-
18
-
19
-
20
-
21
-
22
-
23
-
24
-
25
-
26
-
27
-
28
-
29
-
30
-
31
-
32
-
33
-
34
-
35
-
36
-
37
-
38
-
39
-
40
-
41
-
42
-
43
-
44
-
45
-
46
-
47
-
48
-
49
-
50
-
51
-
52
-
53
-
54
-
55
-
56
-
57
-
58
-
59
-
60
-
61
-
62
-
63
-
64
-
65
-
66
-
67
-
68
-
69
-
70
-
71
-
72
-
73
-
74
-
75
-
76
-
77
-
78
-
79
-
80
-
81
-
82
-
83
-
84
-
85
-
86
-
87
-
88
-
89
-
90
-
91
-
92
-
93
-
94
-
95
-
96
-
97
-
98
-
99
-
100
-
101
-
102
-
103
-
104
-
105
-
106
-
107
-
108
-
109
-
110
-
111
-
112
-
113
-
114
-
115
-
116
-
117
-
118
-
119
-
120
-
121
-
122
-
123
-
124
-
125
-
126
-
127
-
128
-
129
-
130
-
131
-
132
-
133
-
134
-
135
-
136
-
137
-
138
-
139
-
140
-
141
-
142
-
143
-
144
-
145
-
146
-
147
-
148
-
149
-
150
-
151
-
152
-
153
-
154
-
155
-
156
-
157
-
158
-
159
-
160
-
161
-
162
-
163
-
164
-
165
-
166
-
167
-
168
-
169
-
170
-
171
-
172
-
173
-
174
-
175
-
176
-
177
-
178
-
179
-
180
-
181
-
182
-
183
-
184
-
185
-
186
-
187
-
188
-
189
-
190
-
191
-
192
-
193
-
194
-
195
-
196
-
197
-
198
-
199
-
200
-
201
-
202
-
203
-
204
-
205
-
206
-
207
-
208
-
209
-
210
-
211
-
212
-
213
-
214
-
215
-
216
-
217
-
218
-
219
-
220
-
221
-
222
-
223
-
224
-
225
-
226
-
227
-
228
-
229
-
230
-
231
-
232
-
233
-
234
-
235
-
236
-
237
-
238
-
239
-
240
-
241
-
242
-
243
-
244
-
245
-
246
-
247
-
248
-
249
-
250
-
251
-
252
-
253
-
254
-
255
-
256
-
257
-
258
-
259
-
260
-
261
-
262
-
263
-
264
-
265
-
266
-
267
-
268
-
269
-
270
-
271
-
272
-
273
-
274
-
275
-
276
-
277
-
278
-
279
-
280
-
281
-
282
-
283
-
284
-
285
-
286
-
287
-
288
-
289
-
290
-
291
-
292
-
293
-
294
-
295
-
296
-
297
-
298
-
299
-
300
-
301
-
302
-
303
-
304
-
305
-
306
-
307
-
308
-
309
-
310
-
311
-
312
-
313
-
314
-
315
-
316
-
317
-
318
-
319
-
320
-
321
-
322
-
323
-
324
-
325
-
326
-
327
-
328
-
329
-
330
-
331
-
332
-
333
-
334
-
335
-
336
-
337
-
338
-
339
-
340
-
341
-
342
-
343
-
344
-
345
-
346
-
347
-
348
-
349
-
350
-
351
-
 352
352 -
 353
353 -
 354
354 -
 355
355 -
 356
356 -
 357
357 -
 358
358 -
 359
359 -
 360
360 -
 361
361 -
 362
362 -
 363
363 -
 364
364 -
 365
365 -
 366
366 -
 367
367 -
 368
368 -
 369
369 -
 370
370 -
 371
371 -
 372
372 -
373
-
374
-
375
-
376
-
377
-
378
-
379
-
380
-
381
-
382
-
383
-
384
-
385
-
386
-
387
-
388
-
389
-
390
-
391
-
392
-
393
-
394
-
395
-
396
-
397
-
398
-
399
-
400
-
401
-
402
-
403
-
404
-
405
-
406
-
407
-
408
-
409
-
410
-
411
-
412
-
413
-
414
-
415
-
416
-
417
-
418
-
419
-
420
-
421
-
422
-
423
-
424
-
425
-
426
-
427
-
428
-
429
-
430
-
431
-
432
-
433
-
434
-
435
-
436
-
437
-
438
-
439
-
440
 |
 |

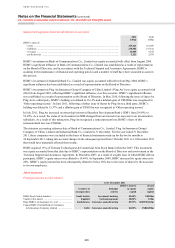
HSBC HOLDINGS PLC
Notes on the Financial Statements (continued)
18 – Reclassification of financial assets / 19 – Financial assets designated at fair value / 20 – Derivatives
360
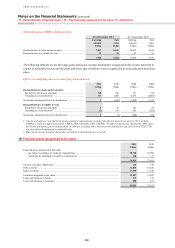
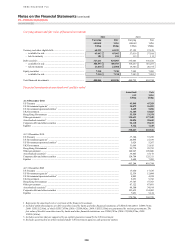
Reclassification of HSBC’s financial assets
At 31 December 2011 At 31 December 2010
Carrying
amount
Fair
value
Carrying
amount
Fair
value
US$m US$m US$m US$m
Reclassification to loans and receivables ..................................... 7,867 6,651 10,947 9,636
Reclassification to available for sale ............................................ 33 33 91 91
7,900 6,684 11,038 9,727
The following table shows the fair value gains and losses, income and expense recognised in the income statement in
respect of reclassified assets and the gains and losses that would have been recognised if no reclassification had taken
place.
Effect of reclassifying and not reclassifying financial assets
2011 2010 2009 2008
US$m US$m US$m US$m
Reclassification to loans and receivables
Recorded in the income statement1 ............................................ 318 610 977 512
Assuming no reclassification2 ................................................... 317 1,260 2,276 (2,801)
Net income statement effect of reclassification ........................... 1 (650) (1,299) 3,313
Reclassification to available for sale
Recorded in the income statement1 ............................................ 1 56 101 22
Assuming no reclassification2 ................................................... (2) 59 301 (202)
Net income statement effect of reclassification ........................... 3 (3) (200) 224
1 ‘Income and expense’ recorded in the income statement represents the accrual of the effective interest rate and, for 2011, includes
US$69m in respect of impairment (2010: US$6m; 2009: US$163m; 2008: US$26m). The effect on the income statement for 2008 shows
the income and expense post-reclassification. In 2008 pre-reclassification, the assets were held at fair value and a loss of US$1,371m
was recorded in the period up to reclassification.
2 Effect on the income statement during the year had the reclassification not occurred.
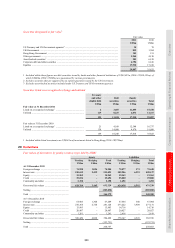
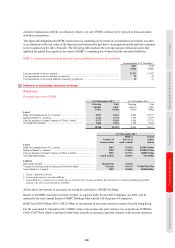
19 Financial assets designated at fair value
2011 2010
US$m US$m
Financial assets designated at fair value:
– not subject to repledge or resale by counterparties .......................................................................... 30,738 36,990
– which may be repledged or resold by counterparties ...................................................................... 118 21
30,856 37,011
Treasury and other eligible bills ............................................................................................................... 123 159
Debt securities .......................................................................................................................................... 11,834 18,248
Equity securities ....................................................................................................................................... 17,930 17,418
Securities designated at fair value ............................................................................................................ 29,887 35,825
Loans and advances to banks ................................................................................................................... 119 315
Loans and advances to customers ............................................................................................................ 850 871
30,856 37,011