HSBC 2011 Annual Report Download - page 353
Download and view the complete annual report
Please find page 353 of the 2011 HSBC annual report below. You can navigate through the pages in the report by either clicking on the pages listed below, or by using the keyword search tool below to find specific information within the annual report.-
 1
1 -
2
-
3
-
4
-
5
-
6
-
7
-
8
-
9
-
10
-
11
-
12
-
13
-
14
-
15
-
16
-
17
-
18
-
19
-
20
-
21
-
22
-
23
-
24
-
25
-
26
-
27
-
28
-
29
-
30
-
31
-
32
-
33
-
34
-
35
-
36
-
37
-
38
-
39
-
40
-
41
-
42
-
43
-
44
-
45
-
46
-
47
-
48
-
49
-
50
-
51
-
52
-
53
-
54
-
55
-
56
-
57
-
58
-
59
-
60
-
61
-
62
-
63
-
64
-
65
-
66
-
67
-
68
-
69
-
70
-
71
-
72
-
73
-
74
-
75
-
76
-
77
-
78
-
79
-
80
-
81
-
82
-
83
-
84
-
85
-
86
-
87
-
88
-
89
-
90
-
91
-
92
-
93
-
94
-
95
-
96
-
97
-
98
-
99
-
100
-
101
-
102
-
103
-
104
-
105
-
106
-
107
-
108
-
109
-
110
-
111
-
112
-
113
-
114
-
115
-
116
-
117
-
118
-
119
-
120
-
121
-
122
-
123
-
124
-
125
-
126
-
127
-
128
-
129
-
130
-
131
-
132
-
133
-
134
-
135
-
136
-
137
-
138
-
139
-
140
-
141
-
142
-
143
-
144
-
145
-
146
-
147
-
148
-
149
-
150
-
151
-
152
-
153
-
154
-
155
-
156
-
157
-
158
-
159
-
160
-
161
-
162
-
163
-
164
-
165
-
166
-
167
-
168
-
169
-
170
-
171
-
172
-
173
-
174
-
175
-
176
-
177
-
178
-
179
-
180
-
181
-
182
-
183
-
184
-
185
-
186
-
187
-
188
-
189
-
190
-
191
-
192
-
193
-
194
-
195
-
196
-
197
-
198
-
199
-
200
-
201
-
202
-
203
-
204
-
205
-
206
-
207
-
208
-
209
-
210
-
211
-
212
-
213
-
214
-
215
-
216
-
217
-
218
-
219
-
220
-
221
-
222
-
223
-
224
-
225
-
226
-
227
-
228
-
229
-
230
-
231
-
232
-
233
-
234
-
235
-
236
-
237
-
238
-
239
-
240
-
241
-
242
-
243
-
244
-
245
-
246
-
247
-
248
-
249
-
250
-
251
-
252
-
253
-
254
-
255
-
256
-
257
-
258
-
259
-
260
-
261
-
262
-
263
-
264
-
265
-
266
-
267
-
268
-
269
-
270
-
271
-
272
-
273
-
274
-
275
-
276
-
277
-
278
-
279
-
280
-
281
-
282
-
283
-
284
-
285
-
286
-
287
-
288
-
289
-
290
-
291
-
292
-
293
-
294
-
295
-
296
-
297
-
298
-
299
-
300
-
301
-
302
-
303
-
304
-
305
-
306
-
307
-
308
-
309
-
310
-
311
-
312
-
313
-
314
-
315
-
316
-
317
-
318
-
319
-
320
-
321
-
322
-
323
-
324
-
325
-
326
-
327
-
328
-
329
-
330
-
331
-
332
-
333
-
334
-
335
-
336
-
337
-
338
-
339
-
340
-
341
-
342
-
 343
343 -
 344
344 -
 345
345 -
 346
346 -
 347
347 -
 348
348 -
 349
349 -
 350
350 -
 351
351 -
 352
352 -
 353
353 -
 354
354 -
 355
355 -
 356
356 -
 357
357 -
 358
358 -
 359
359 -
 360
360 -
 361
361 -
 362
362 -
 363
363 -
364
-
365
-
366
-
367
-
368
-
369
-
370
-
371
-
372
-
373
-
374
-
375
-
376
-
377
-
378
-
379
-
380
-
381
-
382
-
383
-
384
-
385
-
386
-
387
-
388
-
389
-
390
-
391
-
392
-
393
-
394
-
395
-
396
-
397
-
398
-
399
-
400
-
401
-
402
-
403
-
404
-
405
-
406
-
407
-
408
-
409
-
410
-
411
-
412
-
413
-
414
-
415
-
416
-
417
-
418
-
419
-
420
-
421
-
422
-
423
-
424
-
425
-
426
-
427
-
428
-
429
-
430
-
431
-
432
-
433
-
434
-
435
-
436
-
437
-
438
-
439
-
440
 |
 |

351
Overview Operating & Financial Review Corporate Governance Financial Statements Shareholder Information
• differing loss assumptions in setting the level of LGD, which may utilise market recovery rates or levels set by
regulators for capital calculation purposes; and
• counterparty exclusions, whereby certain counterparty types (for example collateralised counterparties) are
excluded from the calculation.
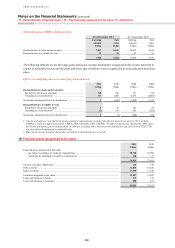
We have estimated the impact of adopting two alternative methodologies on the level of our credit and debit
valuation adjustments (excluding the monoline credit valuation adjustment), as follows:
• adapting our existing methodology to utilise probabilities of default implied from credit default swaps, with no
adjustment factor applied, and also including an adjustment to take into account HSBC’s own probability of
default implied from credit default swaps, results in an overall adverse adjustment of US$1.4bn (2010:
US$0.3bn); and
• adapting our existing DVA methodology to include HSBC’s own probability of default on a basis symmetric
with the current calculation of CVA would result in a favourable reduction of the credit risk charge of US$0.1bn
(2010: US$0.1bn).
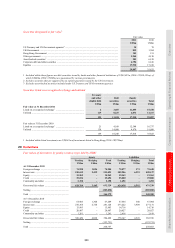
Fair value valuation bases
Financial instruments measured at fair value using a valuation technique with significant unobservable inputs –
Level 3
Assets Liabilities
Available
for sale
Held for
trading
Designated
at fair value
through
profit or loss Derivatives
Held for
trading
Designated
at fair value
through
profit or loss
Derivatives
US$m US$m US$m US$m US$m US$m US$m
At 31 December 2011
Private equity including strategic
investments ................................... 4,565 88 432 – – – –
Asset-backed securities .................... 2,584 710 – – – – –
Loans held for securitisation ............ – 682 – – – – 7
Structured notes ................................ – 92 – – 7,340 – –
Derivatives with monolines .............. – – – 940 – – –
Other derivatives ............................... – – – 3,509 – – 3,122
Other portfolios ................................. 1,972 3,208 284 – 487 567 –
9,121 4,780 716 4,449 7,827 567 3,129
At 31 December 2010
Private equity including strategic
investments ................................... 4,057 278 120 – – – –
Asset-backed securities .................... 1,949 566 – – – – –
Leveraged finance ............................. – – – – – – 11
Loans held for securitisation ............ – 1,043 – – – – –
Structured notes ................................ – – – – 10,667 – –
Derivatives with monolines .............. – – – 1,005 – – –
Other derivatives ............................... – – – 2,956 – – 3,787
Other portfolios ................................. 2,231 3,802 467 – 726 570 8
8,237 5,689 587 3,961 11,393 570 3,806
Private equity and strategic investments
HSBC’s private equity and strategic investments are generally classified as available for sale and are not traded in
active markets. In the absence of an active market, an investment’s fair value is estimated on the basis of an analysis
of the investee’s financial position and results, risk profile, prospects and other factors, as well as by reference to
market valuations for similar entities quoted in an active market, or the price at which similar companies have
changed ownership.
Asset-backed securities
While quoted market prices are generally used to determine the fair value of these securities, valuation models are
used to substantiate the reliability of the limited market data available and to identify whether any adjustments to
quoted market prices are required. For ABSs including residential MBSs, the valuation uses an industry standard