LabCorp 2009 Annual Report Download - page 24
Download and view the complete annual report
Please find page 24 of the 2009 LabCorp annual report below. You can navigate through the pages in the report by either clicking on the pages listed below, or by using the keyword search tool below to find specific information within the annual report.-
 1
1 -
2
-
3
-
4
-
5
-
6
-
7
-
8
-
9
-
10
-
11
-
12
-
13
-
 14
14 -
 15
15 -
 16
16 -
 17
17 -
 18
18 -
 19
19 -
 20
20 -
 21
21 -
 22
22 -
 23
23 -
 24
24 -
 25
25 -
 26
26 -
 27
27 -
 28
28 -
 29
29 -
 30
30 -
 31
31 -
 32
32 -
 33
33 -
 34
34 -
35
-
36
-
37
-
38
-
39
-
40
-
41
-
42
-
43
-
44
-
45
-
46
-
47
-
48
-
49
-
50
-
51
-
52
-
53
-
54
-
55
-
56
-
57
-
58
-
59
-
60
-
61
-
62
-
63
-
64
-
65
-
66
 |
 |

22 LABORATORY CORPORATION OF AMERICA
LABORATORY CORPORATION OF AMERICA
Management’s Discussion and Analysis
of Financial Condition and Results of Operations
(In millions)
General
During 2009, the Company continued to strengthen its financial
performance through pricing discipline, continued growth of
its esoteric testing, outcome improvement and companion
diagnostics offerings, and expense control.
Effective January 1, 2007, the Company commenced its
successful implementation of its ten-year agreement with United
Healthcare Insurance Company (“UnitedHealthcare”) and became
its exclusive national laboratory provider. During the first three
years of the ten-year agreement, the Company committed to
reimburse UnitedHealthcare up to $200.0 for transition costs
related to developing expanded networks in defined markets
during the first three years of the agreement. Since the incep-
tion of this agreement, approximately $108.7 of such transition
payments were billed to the Company by UnitedHealthcare
and approximately $102.8 had been remitted by the Company.
Based on trend rates of the transition payment amounts billed
by UnitedHealthcare during 2009, 2008 and 2007, the Company
believes that its total reimbursement commitment under this
agreement will be approximately $125.6 and that the final
invoices for these payments will be processed over the first
two quarters of 2010. The Company is amortizing the total
estimated transition costs over the life of the contract.
Effective January 1, 2008 the Company acquired additional
partnership units in its Ontario, Canada (“Ontario”) joint venture
for approximately $140.9 in cash (net of cash acquired), bringing
the Company’s percentage interest owned to 85.6%. Concurrent
with this acquisition, the terms of the joint venture’s partnership
agreement were amended. Based upon the amended terms of
this agreement, the Company began including the consolidated
operating results, financial position and cash flows of the Ontario
joint venture in the Company’s consolidated financial statements
on January 1, 2008. In December 2009, the Company received
notification from the holders of the noncontrolling interest in
the Ontario joint venture that they intend to put their remaining
partnership units to the Company in accordance with the terms
of the joint venture’s partnership agreement. These units were
acquired on February 8, 2010 for CN$147.8. On February 17,
2010, the Company completed a transaction to sell the units
acquired from the previous noncontrolling interest holder to a
new Canadian partner for the same price. Upon the completion
of these two transactions, the Company’s financial ownership
percentage in the joint venture partnership remained unchanged
at 85.6%. Concurrent with the sale to the new partner, the
partnership agreement for the Ontario Canada joint venture
was amended and restated with substantially the same terms
as the previous agreement. The contractual value of the put,
in excess of the current noncontrolling interest of $23.5, totaled
$118.9 at December 31, 2009.
Seasonality
The majority of the Company’s testing volume is dependent on
patient visits to doctor’s offices and other providers of health
care. Volume of testing generally declines during the year-end
holiday periods and other major holidays. In addition, volume
declines due to inclement weather may reduce net revenues and
cash flows. Therefore, comparison of the results of successive
quarters may not accurately reflect trends or results for the
full year.
Results of Operations
(amounts in millions except Revenue Per Requisition info)
Years Ended December 31, 2009, 2008, and 2007
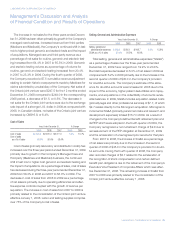
Net Sales
Years Ended December 31, % Change
2009 2008 2007 2009 2008
Net sales
Routine Testing $ 2,845.6 $ 2,777.9 $ 2,671.9 2.4% 4.0%
Genomic and
Esoteric Testing 1,601.6 1,478.3 1,396.3 8.3% 5.9%
Ontario, Canada 247.5 249.0 – (0.6)% N/A
Total $ 4,694.7 $ 4,505.2 $ 4,068.2 4.2% 10.7%
Years Ended December 31, % Change
2009 2008 2007 2009 2008
Volume
Routine Testing 84.6 86.0 85.4 (1.6)% 0.7%
Genomic and
Esoteric Testing 25.8 23.7 21.9 8.9% 8.2%
Ontario, Canada 9.1 8.0 – 12.9% N/A
Total 119.5 117.7 107.3 1.5% 9.7%
Years Ended December 31, % Change
2009 2008 2007 2009 2008
Revenue per requisition
Routine Testing $ 33.62 $ 32.30 $ 31.29 4.1% 3.2%
Genomic and
Esoteric Testing $ 62.14 $ 62.49 $ 63.76 (0.6)% (2.0)%
Ontario, Canada $ 27.24 $ 30.92 $ – (11.9)% N/A
Total $ 39.29 $ 38.28 $ 37.92 2.6% 0.9%