LabCorp 2009 Annual Report Download - page 25
Download and view the complete annual report
Please find page 25 of the 2009 LabCorp annual report below. You can navigate through the pages in the report by either clicking on the pages listed below, or by using the keyword search tool below to find specific information within the annual report.-
 1
1 -
2
-
3
-
4
-
5
-
6
-
7
-
8
-
9
-
10
-
11
-
12
-
13
-
14
-
 15
15 -
 16
16 -
 17
17 -
 18
18 -
 19
19 -
 20
20 -
 21
21 -
 22
22 -
 23
23 -
 24
24 -
 25
25 -
 26
26 -
 27
27 -
 28
28 -
 29
29 -
 30
30 -
 31
31 -
 32
32 -
 33
33 -
 34
34 -
 35
35 -
36
-
37
-
38
-
39
-
40
-
41
-
42
-
43
-
44
-
45
-
46
-
47
-
48
-
49
-
50
-
51
-
52
-
53
-
54
-
55
-
56
-
57
-
58
-
59
-
60
-
61
-
62
-
63
-
64
-
65
-
66
 |
 |

LABORATORY CORPORATION OF AMERICA 23
LABORATORY CORPORATION OF AMERICA
Management’s Discussion and Analysis
of Financial Condition and Results of Operations
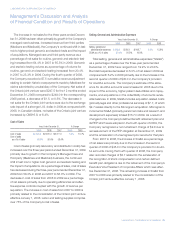
The increase in net sales for the three years ended Decem-
ber 31, 2009 has been driven primarily by growth in the Company’s
managed care business, increased revenue from third parties
(Medicare and Medicaid), the Company’s continued shift in test
mix to higher-priced genomic and esoteric tests and the impact
of acquisitions. Managed care and third-party revenue as a
percentage of net sales for routine, genomic and estoteric test-
ing increased from 64.4% in 2007 to 65.3% in 2009. Genomic
and esoteric testing volume as a percentage of volume for
routine, genomic and esoteric testing increased from 20.4%
in 2007 to 23.3% in 2009. During the fourth quarter of 2008,
the Company recorded a $7.5 cumulative revenue adjustment
relating to certain historic overpayments made by Medicare for
claims submitted by a subsidiary of the Company. Net sales of
the Ontario joint venture were $247.5 for the 12 months ended
December 31, 2009 compared to $249.0 in the corresponding
2008 period, a decrease of $1.5, or 0.6%. The decrease in
net sales for the Ontario joint venture was due to the exchange
rate impact of a stronger U.S. dollar in 2009 as compared with
2008. In Canadian dollars, net sales of the Ontario joint venture
increased by CN$16.9, or 6.4%.
Cost of Sales
Years Ended December 31, % Change
2009 2008 2007 2009 2008
Cost of sales $ 2,723.8 $ 2,631.4 $ 2,377.0 3.5% 10.7%
Cost of sales
as a % of sales 58.0% 58.4% 58.4%
Cost of sales (primarily laboratory and distribution costs) has
increased over the three year period ended December 31, 2009
primarily due to growth in the Company’s Managed Care and
third party (Medicare and Medicaid) business, the continued
shift in test mix to higher cost genomic and esoteric testing and
the impact of acquisitions. As a percentage of sales, cost of sales
has decreased during the three-year period ended December 31,
2009 from 58.4% in 2008 and 2007 to 58.0% in 2009. The
decrease in cost of sales from 2008 to 2009 as a percentage
of net sales is primarily due to operating efficiencies and effec-
tive expense controls coupled with the growth of revenue per
requisition. The increase in cost of sales from 2007 to 2008 is
primarily related to the consolidation of the Ontario joint venture
effective January 1, 2008. Labor and testing supplies comprise
over 75% of the Company’s cost of sales.
Selling, General and Adminstrative Expenses
Years Ended December 31, % Change
2009 2008 2007 2009 2008
Selling, general and
administrative expenses $ 958.9 $ 935.1 $ 808.7 2.5% 15.6%
SG&A as a % of sales 20.4% 20.8% 19.9%
Total selling, general and administrative expenses (“SG&A”)
as a percentage of sales over the three-year period ended
December 31, 2009 have ranged from 19.9% to 20.8%.
Bad debt expense decreased to 5.3% of net sales in 2009 as
compared with 6.2% in 2008 primarily due to the increase in the
second quarter of 2008 of $45.0 in the Company’s provision
for doubtful accounts. The Company’s estimate of the allow-
ance for doubtful accounts was increased in 2008 due to the
impact of the economy, higher patient deductibles and copay-
ments, and acquisitions on the collectibility of accounts receiv-
able balances. In 2009, SG&A includes acquisition related costs
(primarily legal and other professional services) of $7.7, of which
$2.7 relates directly to the Monogram acquisition. Monogram’s
incremental SG&A (primarily personnel costs and research and
development expenses) totaled $15.7 in 2009. As a result of
changes to the Company’s defined benefit retirement plan and
its PEP which were adopted in the fourth quarter of 2009, the
Company recognized a net curtailment charge of $2.8 due to
remeasurement of the PEP obligation at December 31, 2009
and the acceleration of unrecognized prior service for that plan.
From 2007 to 2008, the increase in SG&A as a percentage
of net sales was primarly due to the increase in the second
quarter of 2008 of $45.0 in the Company’s provision for doubt-
ful accounts. During the fourth quarter of 2008, the Company
also recorded charges of $3.7 related to the acceleration of
the recognition of stock compensation and certain defined
benefit plan obligations due to the retirement of the Company’s
Executive Vice President of Corporate Affairs which was effec-
tive December 31, 2008. The remaining increase in SG&A from
2007 to 2008 was primarily related to the consolidation of the
Ontario joint venture effective January 1, 2008.