LabCorp 2009 Annual Report Download - page 50
Download and view the complete annual report
Please find page 50 of the 2009 LabCorp annual report below. You can navigate through the pages in the report by either clicking on the pages listed below, or by using the keyword search tool below to find specific information within the annual report.-
 1
1 -
2
-
3
-
4
-
5
-
6
-
7
-
8
-
9
-
10
-
11
-
12
-
13
-
14
-
15
-
16
-
17
-
18
-
19
-
20
-
21
-
22
-
23
-
24
-
25
-
26
-
27
-
28
-
29
-
30
-
31
-
32
-
33
-
34
-
35
-
36
-
37
-
38
-
39
-
 40
40 -
 41
41 -
 42
42 -
 43
43 -
 44
44 -
 45
45 -
 46
46 -
 47
47 -
 48
48 -
 49
49 -
 50
50 -
 51
51 -
 52
52 -
 53
53 -
 54
54 -
 55
55 -
 56
56 -
 57
57 -
 58
58 -
 59
59 -
 60
60 -
61
-
62
-
63
-
64
-
65
-
66
 |
 |

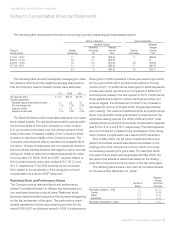
48 LABORATORY CORPORATION OF AMERICA
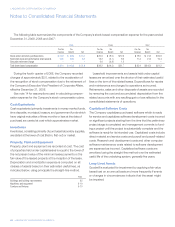
amended. Based upon the amended terms of this agreement,
the Company began including the consolidated operating
results, financial position and cash flows of the Ontario joint
venture in the Company’s consolidated financial statements
on January 1, 2008. As a result, the below disclosures in
connection with investments in joint venture partnerships do not
include the Ontario joint venture as of and for the years ended
December 31, 2009 and 2008.
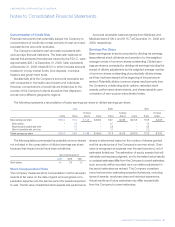
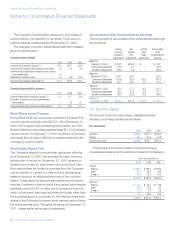
At December 31, 2009 the Company had investments in
the following unconsolidated joint venture partnerships:
Net Percentage
Location Investment Interest Owned
Milwaukee, Wisconsin $ 10.4 50.00%
Alberta, Canada 59.7 43.37%
Cincinnati, Ohio 1.3 50.00%
The joint venture agreements that govern the conduct of
business of these partnerships mandates unanimous agree-
ment between partners on all major business decisions as
well as providing other participating rights to each partner.
The partnerships are accounted for under the equity method
of accounting as the Company does not have control of these
partnerships. The Company has no material obligations or
guarantees to, or in support of, these unconsolidated joint
ventures and their operations.
Condensed unconsolidated financial information for joint
venture partnerships is shown in the following table (the
Ontario, Canada joint venture information included for the
2007 information only).
As of December 31: 2009 2008
Current assets $ 35.3 $ 28.5
Other assets 41.4 31.4
Total assets $ 76.7 $ 59.9
Current liabilities $ 28.0 $ 18.7
Other liabilities 2.3 2.5
Total liabilities 30.3 21.2
Partners’ equity 46.4 38.7
Total liabilities and partners’ equity $ 76.7 $ 59.9
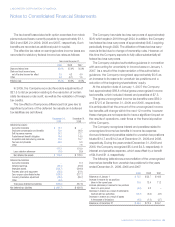
For the period January 1 - December 31: 2009 2008 2007
Net sales $ 212.4 $ 182.0 $ 403.4
Gross profit 69.6 69.0 190.9
Net earnings 33.3 34.3 120.9
The Company’s recorded investment in the Alberta joint
venture partnership at December 31, 2009 includes $48.4 of
value assigned to the partnership’s Canadian licenses (with
an indefinite life and deductible for tax) to conduct diagnostic
testing services in the province.
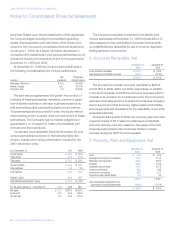
6. Accounts Receivable, Net
December 31, December 31,
2009 2008
Gross accounts receivable $ 747.3 $ 792.6
Less allowance for doubtful accounts (173.1) (161.0)
$ 574.2 $ 631.6
The provision for doubtful accounts was $248.9, $232.8
and $196.2 in 2009, 2008 and 2007, respectively. In addition,
in the second quarter of 2008 the Company recorded a $45.0
increase in its provision for doubtful accounts. The Company’s
estimate of the allowance for doubtful accounts was increased
due to the impact of the economy, higher patient deductibles
and copayments and acquisitions on the collectibility of accounts
receivable balances.
During the third quarter of 2008, the Company also recorded
a special charge of $5.5 related to estimated uncollectible
amounts primarily owed by patients in the areas of the Gulf
Coast severely impacted by hurricanes similar to losses
incurred during the 2005 hurricane season.
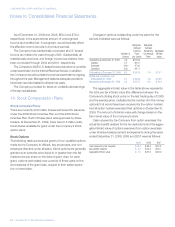
7. Property, Plant and Equipment, Net
December 31, December 31,
2009 2008
Land $ 23.4 $ 20.6
Buildings and building improvements 116.7 115.2
Machinery and equipment 584.8 558.9
Software 289.6 278.9
Leasehold improvements 147.0 127.9
Furniture and fixtures 48.4 44.6
Construction in progress 49.8 57.1
Equipment under capital leases 3.5 3.5
1,263.2 1,206.7
Less accumulated depreciation and
amortization of capital lease assets (762.4) (710.3)
$ 500.8 $ 496.4
LABORATORY CORPORATION OF AMERICA
Notes to Consolidated Financial Statements