LabCorp 2009 Annual Report Download - page 43
Download and view the complete annual report
Please find page 43 of the 2009 LabCorp annual report below. You can navigate through the pages in the report by either clicking on the pages listed below, or by using the keyword search tool below to find specific information within the annual report.-
 1
1 -
2
-
3
-
4
-
5
-
6
-
7
-
8
-
9
-
10
-
11
-
12
-
13
-
14
-
15
-
16
-
17
-
18
-
19
-
20
-
21
-
22
-
23
-
24
-
25
-
26
-
27
-
28
-
29
-
30
-
31
-
32
-
 33
33 -
 34
34 -
 35
35 -
 36
36 -
 37
37 -
 38
38 -
 39
39 -
 40
40 -
 41
41 -
 42
42 -
 43
43 -
 44
44 -
 45
45 -
 46
46 -
 47
47 -
 48
48 -
 49
49 -
 50
50 -
 51
51 -
 52
52 -
 53
53 -
54
-
55
-
56
-
57
-
58
-
59
-
60
-
61
-
62
-
63
-
64
-
65
-
66
 |
 |

LABORATORY CORPORATION OF AMERICA 41
LABORATORY CORPORATION OF AMERICA
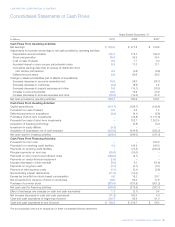
Notes to Consolidated Financial Statements
Concentration of Credit Risk
Financial instruments that potentially subject the Company to
concentrations of credit risk consist primarily of cash and cash
equivalents and accounts receivable.
The Company maintains cash and cash equivalents with
various major financial institutions. The total cash balances on
deposit that exceeded the balances insured by the F.D.I.C., were
approximately $26.7 at December 31, 2009. Cash equivalents
at December 31, 2009, totaled $131.0, which includes amounts
invested in money market funds, time deposits, municipal,
treasury and government funds.
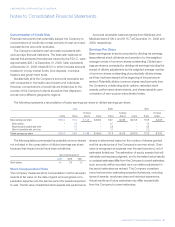
Substantially all of the Company’s accounts receivable are
with companies in the health care industry and individuals.
However, concentrations of credit risk are limited due to the
number of the Company’s clients as well as their dispersion
across many different geographic regions.
Accounts receivable balances (gross) from Medicare and
Medicaid were $106.4 and $115.7 at December 31, 2009 and
2008, respectively.
Earnings Per Share
Basic earnings per share is computed by dividing net earnings,
less preferred stock dividends and accretion, by the weighted
average number of common shares outstanding. Diluted earn-
ings per share is computed by dividing net earnings including the
impact of dilutive adjustments by the weighted-average number
of common shares outstanding plus potentially dilutive shares,
as if they had been issued at the beginning of the period pre-
sented. Potentially dilutive common shares result primarily from
the Company’s outstanding stock options, restricted stock
awards, performance share awards, and shares issuable upon
conversion of zero-coupon subordinated notes.
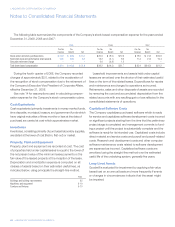
The following represents a reconciliation of basic earnings per share to diluted earnings per share:
2009 2008 2007
Per Share Per Share Per Share
Income Shares Amount Income Shares Amount Income Shares Amount
Basic earnings per share $ 543.3 107.4 $ 5.06 $ 464.5 109.7 $ 4.23 $ 476.8 116.8 $ 4.08
Stock options – 0.5 – 0.7 – 1.2
Restricted stock awards and other – 0.2 – 0.3 – 0.8
Effect of convertible debt, net of tax – 1.0 – 1.1 – 2.5
Diluted earnings per share $ 543.3 109.1 $ 4.98 $ 464.5 111.8 $ 4.16 $ 476.8 121.3 $ 3.93
The following table summarizes the potential common shares
not included in the computation of diluted earnings per share
because their impact would have been antidilutive:
Years Ended December 31,
2009 2008 2007
Stock options 4.6 2.4 1.2
Stock Compensation Plans
The Company measures stock compensation cost for all equity
awards at fair value on the date of grant and recognizes com-
pensation expense over the service period for awards expected
to vest. The fair value of restricted stock awards and performance
shares is determined based on the number of shares granted
and the quoted price of the Company’s common stock. Such
value is recognized as expense over the service period, net of
estimated forfeitures. The estimation of equity awards that will
ultimately vest requires judgment, and to the extent actual results
or updated estimates differ from the Company’s current estimates,
such amounts will be recorded as a cumulative adjustment in
the period estimates are revised. The Company considers
many factors when estimating expected forfeitures, including
types of awards, employee class and historical experience.
Actual results and future estimates may differ substantially
from the Company’s current estimates.