LabCorp 2009 Annual Report Download - page 41
Download and view the complete annual report
Please find page 41 of the 2009 LabCorp annual report below. You can navigate through the pages in the report by either clicking on the pages listed below, or by using the keyword search tool below to find specific information within the annual report.-
 1
1 -
2
-
3
-
4
-
5
-
6
-
7
-
8
-
9
-
10
-
11
-
12
-
13
-
14
-
15
-
16
-
17
-
18
-
19
-
20
-
21
-
22
-
23
-
24
-
25
-
26
-
27
-
28
-
29
-
30
-
 31
31 -
 32
32 -
 33
33 -
 34
34 -
 35
35 -
 36
36 -
 37
37 -
 38
38 -
 39
39 -
 40
40 -
 41
41 -
 42
42 -
 43
43 -
 44
44 -
 45
45 -
 46
46 -
 47
47 -
 48
48 -
 49
49 -
 50
50 -
 51
51 -
52
-
53
-
54
-
55
-
56
-
57
-
58
-
59
-
60
-
61
-
62
-
63
-
64
-
65
-
66
 |
 |

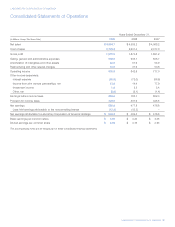
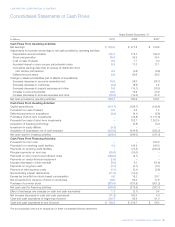
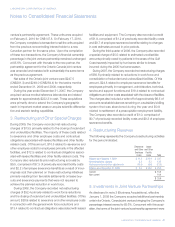
LABORATORY CORPORATION OF AMERICA 39
LABORATORY CORPORATION OF AMERICA
Consolidated Statements of Cash Flows
Years Ended December 31,
(In Millions) 2009 2008 2007
Cash Flows From Operating Activities:
Net earnings $ 555.6 $ 477.8 $ 476.8
Adjustments to reconcile net earnings to net cash provided by operating activities:
Depreciation and amortization 195.1 179.7 162.8
Stock compensation 36.4 36.2 35.4
Loss on sale of assets 2.6 1.1 0.2
Accreted interest on zero-coupon subordinated notes 8.3 11.3 11.1
Cumulative earnings less than (in excess of) distribution from
joint venture partnerships 2.2 (0.6) (8.6)
Deferred income taxes 9.6 69.6 26.5
Change in assets and liabilities (net of effects of acquisitions):
(Increase) decrease in accounts receivable (net) 74.0 28.0 (78.7)
(Increase) decrease in inventories (4.3) (8.6) 4.8
(Increase) decrease in prepaid expenses and other 5.9 (15.1) (16.3)
Increase in accounts payable 22.8 15.9 33.9
Increase (decrease) in accrued expenses and other (45.8) (14.4) 61.8
Net cash provided by operating activities 862.4 780.9 709.7
Cash Flows From Investing Activities:
Capital expenditures (114.7) (156.7) (142.6)
Proceeds from sale of assets 0.9 0.5 1.4
Deferred payments on acquisitions (3.3) (4.1) (2.8)
Purchases of short-term investments – (72.8) (1,777.9)
Proceeds from sale of short-term investments – 182.7 1,803.4
Acquisition of licensing technology – (0.8) (0.7)
Investment in equity affiliate (4.3) – –
Acquisition of businesses, net of cash acquired (212.6) (344.8) (222.3)
Net cash used for investing activities (334.0) (396.0) (341.5)
Cash Flows From Financing Activities:
Proceeds from term loan – – 500.0
Proceeds from revolving credit facilities 4.2 145.2 240.0
Payments on revolving credit facilities – (74.4) (240.0)
Principal payments on term loan (50.0) (25.0) –
Payments on zero-coupon subordinated notes (289.4) (2.1) –
Payments on vendor-financed equipment (1.5) – –
Increase (decrease) in bank overdraft (5.0) 5.0 (34.9)
Payments on long-term debt (0.1) (0.1) (0.1)
Payment of debt issuance costs (0.1) (0.1) (5.8)
Noncontrolling interest distributions (11.3) (14.0) –
Excess tax benefits from stock based compensation 0.5 16.2 20.7
Net proceeds from issuance of stock to employees 24.8 64.4 77.6
Purchase of common stock (273.0) (333.6) (921.2)
Net cash used for financing activities (600.9) (218.5) (363.7)
Effect of exchange rate changes on cash and cash equivalents 1.3 (3.1) 0.4
Net increase (decrease) in cash and cash equivalents (71.2) 163.3 4.9
Cash and cash equivalents at beginning of period 219.7 56.4 51.5
Cash and cash equivalents at end of period $ 148.5 $ 219.7 $ 56.4
The accompanying notes are an integral part of these consolidated financial statements.