Lowe's 2007 Annual Report Download - page 23
Download and view the complete annual report
Please find page 23 of the 2007 Lowe's annual report below. You can navigate through the pages in the report by either clicking on the pages listed below, or by using the keyword search tool below to find specific information within the annual report.-
 1
1 -
2
-
3
-
4
-
5
-
6
-
7
-
8
-
9
-
10
-
11
-
12
-
 13
13 -
 14
14 -
 15
15 -
 16
16 -
 17
17 -
 18
18 -
 19
19 -
 20
20 -
 21
21 -
 22
22 -
 23
23 -
 24
24 -
 25
25 -
 26
26 -
 27
27 -
 28
28 -
 29
29 -
 30
30 -
 31
31 -
 32
32 -
 33
33 -
34
-
35
-
36
-
37
-
38
-
39
-
40
-
41
-
42
-
43
-
44
-
45
-
46
-
47
-
48
-
49
-
50
-
51
-
52
 |
 |

LOWE’S 2007 ANNUAL REPORT |21
Effect if actual results differ from assumptions
If actual results are not consistent with the assumptions and estimates used,
we could be exposed to additional adjustments that could positively or negatively
impact gross margin and inventory. However, substantially all receivables
associated with these activities are collected within the following fiscal year
and therefore do not require subjective long-term estimates.Adjustments to
gross margin and inventory in the following fiscal year have historically not
been material.
OPERATIONS
The following table sets forth the percentage relationship to net sales of each line
item of the consolidated statements of earnings,as well as the percentage change
in dollar amounts from the prior year.This table should be read in conjunction with
the following discussion and analysis and the consolidated financial statements,
including the related notes to the consolidated financial statements.
Basis Point Percentage
Increase/ Increase/
(Decrease) (Decrease)
in Percentage in Dollar
of Net Sales Amounts
from from
Prior Year Prior Year
2007 vs. 2007 vs.
2007 2006 2006 2006
Net sales 100.00% 100.00% N/A 2.9%
Gross margin 34.64 34.52 12 3.3
Expenses:
Selling, general
and administrative 21.78 20.75 103 8.0
Store opening costs 0.29 0.31 (2) (3.9)
Depreciation 2.83 2.48 35 17.5
Interest – net 0.40 0.33 7 26.4
Total expenses 25.30 23.87 143 9.1
Pre-tax earnings 9.34 10.65 (131) (9.7)
Income tax provision 3.52 4.03 (51) (10.1)
Net earnings 5.82% 6.62% (80) (9.5%)
Basis Point Percentage
Increase/ Increase/
(Decrease) (Decrease)
in Percentage in Dollar
of Net Sales Amounts
from from
Prior Year
1
Prior Year
1
2006 vs. 2006 vs.
2006 2005 2005 2005
Net sales 100.00% 100.00% N/A 8.5%
Gross margin 34.52 34.20 32 9.5
Expenses:
Selling, general
and administrative 20.75 20.84 (9) 8.0
Store opening costs 0.31 0.33 (2) 2.7
Depreciation 2.48 2.27 21 18.6
Interest – net 0.33 0.37 (4) (2.7)
Total expenses 23.87 23.81 6 8.8
Pre-tax earnings 10.65 10.39 26 11.1
Income tax provision 4.03 4.00 3 9.3
Net earnings 6.62% 6.39% 23 12.3%
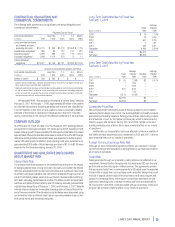
Other Metrics 2007 2006 2005
Comparable store sales (decrease)/increase 2(5.1%) 0.0% 6.1%
Customer transactions (in millions)1720 680 639
Average ticket 1, 3 $67.05 $68.98 $67.67
At end of year:
Number of stores 1,534 1,385 1,234
Sales floor square feet (in millions) 174 157 140
Average store size selling
square feet (in thousands)4113 113 113
Return on average assets1, 5 9.5% 11.7% 11.9%
Return on average shareholders’ equity1, 6 17.7% 20.8% 21.5%
1Fiscal years 2007 and 2006 had 52 weeks. Fiscal year 2005 had 53 weeks.
2We define a comparable store as a store that has been open longer than 13 months.A store that
is identified for relocation is no longer considered comparable one month prior to its relocation.
The relocated store must then remain open longer than 13 months to be considered comparable.
The comparable store sales increase for 2006 included in the preceding table was calculated
using sales for a comparable 52-week period, while the comparable store sales increase for
2005 was calculated using sales for a comparable 53-week period.
3We define average ticket as net sales divided by the number of customer transactions.
4We define average store size selling square feet as sales floor square feet divided by the number
of stores open at the end of the period.
5Return on average assets is defined as net earnings divided by average total assets for the last
five quarters.
6Return on average shareholders’ equity is defined as net earnings divided by average shareholders’
equity for the last five quarters.
Fiscal 2007 Compared to Fiscal 2006
Net sales
Sales increased 2.9% to $48.3 billion in 2007. The increase in sales was
driven primarily by our store expansion program. We opened 153 stores in
2007, including four relocations, and ended the year with 1,534 stores in the
U.S. and Canada. However, a challenging sales environment led to a decline
in comparable store sales of 5.1% in 2007 versus flat comparable store sales
in 2006.Total customer transactions increased 5.9% compared to 2006, while
average ticket decreased 2.8% to $67.05, a reflection of fewer project sales.
Comparable store customer transactions declined 1.8% and comparable store
average ticket declined 3.3% compared to 2006.
Comparable store sales declined 6.3%,2.6%,4.3% and 7.6% in the first,
second, third and fourth quarters of 2007, respectively. Our industry was
pressured by the soft housing market, the tight mortgage market, continued
deflationary pressures from lumber and plywood, and unseasonable weather,
including the exceptional drought in certain areas of the U.S. From a geographic
market perspective,we continued to see dramatic differences in performance.
Our worst performing markets included those areas that had been most
impacted by the dynamics of the housing market, including California and
Florida.These areas and the Gulf Coast reduced total company comparable
store sales by approximately 250 basis points for the year. Contrasting with
those markets, we saw relatively better comparable store sales performance
in our markets in the central U.S. that have had less impact from the housing
market. Two of these markets, which include areas of Texas and Oklahoma,
delivered positive comparable store sales in 2007 and had a positive impact
on total company comparable store sales of approximately 100 basis points
for the year.
Reflective of the difficult sales environment, only two of our 19 product
categories experienced comparable store sales increases in 2007. The
categories that performed above our average comparable store sales change
included rough plumbing, lawn & landscape products,hardware, paint,lighting,
nursery, fashion plumbing and appliances.In addition, outdoor power equip-
ment performed at approximately our average comparable store sales change
in 2007. Despite the difficult sales environment,we were able to gain unit market
share of 80 basis points for the total store in calendar year 2007, according to
third-party estimates. Continued strong unit market share gains indicate that
we are providing great service and value to customers.