Lowe's 2007 Annual Report Download - page 41
Download and view the complete annual report
Please find page 41 of the 2007 Lowe's annual report below. You can navigate through the pages in the report by either clicking on the pages listed below, or by using the keyword search tool below to find specific information within the annual report.-
 1
1 -
2
-
3
-
4
-
5
-
6
-
7
-
8
-
9
-
10
-
11
-
12
-
13
-
14
-
15
-
16
-
17
-
18
-
19
-
20
-
21
-
22
-
23
-
24
-
25
-
26
-
27
-
28
-
29
-
30
-
 31
31 -
 32
32 -
 33
33 -
 34
34 -
 35
35 -
 36
36 -
 37
37 -
 38
38 -
 39
39 -
 40
40 -
 41
41 -
 42
42 -
 43
43 -
 44
44 -
 45
45 -
 46
46 -
 47
47 -
 48
48 -
 49
49 -
 50
50 -
 51
51 -
52
 |
 |

LOWE’S 2007 ANNUAL REPORT |39
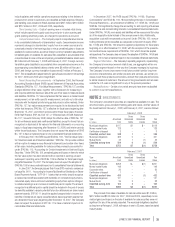
to estimate the timing and amount of forfeitures. These options are expensed
on a straight-line basis over the vesting period, which is considered to be the
requisite service period. The assumptions used in the Black-Scholes option-
pricing model for options granted in the three years ended February 1, 2008,
February 2, 2007 and February 3, 2006 were as follows:
2007 2006 2005
Assumptions used:
Expected volatility 22.6%–23.7% 22.3%–29.4% 25.8%–34.1%
Weighted-average
expected volatility 23.7% 26.8% 31.4%
Expected dividend yield 0.37%–0.49% 0.27%–0.31% 0.23%–0.28%
Weighted-average
dividend yield 0.37% 0.28% 0.24%
Risk-free interest rate 3.91%–4.57% 4.54%–4.97% 3.76%–4.44%
Weighted-average risk-free
interest rate 4.52% 4.69% 3.81%
Expected term, in years 4 3–4 3–4
Weighted-average expected
term, in years 4 3.57 3.22
The weighted-average grant-date fair value per share of options granted
was $8.18, $8.86 and $7.81 in 2007, 2006 and 2005, respectively.The total
intrinsic value of options exercised, representing the difference between the
exercise price and the market price on the date of exercise, was approximately
$42 million,$80 million and $175 million in 2007, 2006 and 2005, respectively.
Transactions related to stock options issued under the 2006,2001, 1997,
1994 and Directors’ plans for the year ended February 1, 2008 are summarized
as follows:
Weighted-
Weighted- Average Aggregate
Average Remaining Intrinsic
Shares Exercise Price Term Value
(In thousands) Per Share (In years) (In thousands)
1
Outstanding at
February 2, 2007 30,388 $25.51
Granted 1,834 32.17
Canceled, forfeited
or expired (905) 31.70
Exercised (3,750) 18.92
Outstanding at
February 1, 2008 27,567 26.65 3.08 $53,972
Vested and expected
to vest at
February 1, 2008227,177 26.56 3.07 53,972
Exercisable at
February 1, 2008 20,554 $24.69 2.38 $53,972
1Options for which the exercise price exceeded the closing market price of a share of the Company’s
common stock at February 1, 2008 are excluded from the calculation of aggregate intrinsic value.
2Includes outstanding vested options as well as outstanding, nonvested options after a forfeiture
rate is applied.
Performance Accelerated Restricted Stock Awards
PARS are valued at the market price of a share of the Company’s common
stock on the date of grant. In general, these awards vest at the end of a five-
year service period from the date of grant, unless performance acceleration
goals are achieved, in which case, awards vest 50% at the end of three years
or 100% at the end of four years. The performance acceleration goals are
based on targeted Company average return on beginning noncash assets, as
defined in the PARS agreement. PARS are expensed on a straight-line basis
over the shorter of the explicit service period related to the service condition
or the implicit service period related to the performance conditions, based on
the probability of meeting the conditions. The Company uses historical data to
estimate the timing and amount of forfeitures.The weighted-average grant-date
fair value per share of PARS granted was $34.10 and $29.24 in 2006 and 2005,
respectively. No PARS were granted in 2007.The total fair value of PARS vested
was approximately $1 million in 2005. No PARS vested in 2007 or 2006.
Transactions related to PARS issued under the 2006 and 2001 plans
for the year ended February 1, 2008 are summarized as follows:
Weighted-Average
Grant-Date Fair
Shares Value Per Share
Nonvested at February 2, 2007 1,438,580 $32.17
Granted – –
Canceled or forfeited (63,894) 31.63
Nonvested at February 1, 2008 1,374,686 $32.19
Performance-Based Restricted Stock Awards
Performance-based restricted stock awards are valued at the market price of
a share of the Company’s common stock on the date of grant. In general, these
awards vest at the end of a three-year service period from the date of grant only
if the performance goal specified in the performance-based restricted stock
agreement is achieved. The performance goal is based on targeted Company
average return on noncash assets, as defined in the performance-based
restricted stock agreement. These awards are expensed on a straight-line
basis over the requisite service period, based on the probability of achieving
the performance goal.The Company uses historical data to estimate the timing
and amount of forfeitures.The weighted-average grant-date fair value per share
of performance-based restricted stock awards granted was $32.18 in 2007.
No performance-based restricted stock awards were granted in 2006 or 2005.
No performance-based restricted stock awards vested in 2007, 2006 or 2005.
Transactions related to performance-based restricted stock awards issued
under the 2006 plan for the year ended February 1, 2008 are summarized
as follows:
Weighted-Average
Grant-Date Fair
Shares Value Per Share
Nonvested at February 2, 2007 – $ –
Granted 601,730 32.18
Canceled or forfeited – –
Nonvested at February 1, 2008 601,730 $32.18
Restricted Stock Awards
Restricted stock awards are valued at the market price of a share of the
Company’s common stock on the date of grant. In general, these awards vest
at the end of a three- to five-year period from the date of grant and are expensed
on a straight-line basis over that period,which is considered to be the requisite
service period. The Company uses historical data to estimate the timing and
amount of forfeitures. The weighted-average grant-date fair value per share
of restricted stock awards granted was $31.23, $27.34 and $32.30 in 2007,
2006 and 2005, respectively. The total fair value of restricted stock awards
vested was approximately $17 million and $4 million in 2007 and 2005,
respectively. No restricted stock awards vested in 2006.
Transactions related to restricted stock awards issued under the 2006 and
2001 plans for the year ended February 1, 2008 are summarized as follows:
Weighted-Average
Grant-Date Fair
Shares Value Per Share
Nonvested at February 2, 2007 1,887,582 $30.77
Granted 1,968,880 31.23
Vested (527,368) 28.76
Canceled or forfeited (220,707) 32.07
Nonvested at February 1, 2008 3,108,387 $31.31
Deferred Stock Units
Deferred stock units are valued at the market price of a share of the Company’s
common stock on the date of grant. For key employees, these awards gener-
ally vest over three to five years and are expensed on a straight-line basis over
that period, which is considered to be the requisite service period. The Com-
pany uses historical data to estimate the timing and amount of forfeitures.