Lowe's 2007 Annual Report Download - page 45
Download and view the complete annual report
Please find page 45 of the 2007 Lowe's annual report below. You can navigate through the pages in the report by either clicking on the pages listed below, or by using the keyword search tool below to find specific information within the annual report.-
 1
1 -
2
-
3
-
4
-
5
-
6
-
7
-
8
-
9
-
10
-
11
-
12
-
13
-
14
-
15
-
16
-
17
-
18
-
19
-
20
-
21
-
22
-
23
-
24
-
25
-
26
-
27
-
28
-
29
-
30
-
31
-
32
-
33
-
34
-
 35
35 -
 36
36 -
 37
37 -
 38
38 -
 39
39 -
 40
40 -
 41
41 -
 42
42 -
 43
43 -
 44
44 -
 45
45 -
 46
46 -
 47
47 -
 48
48 -
 49
49 -
 50
50 -
 51
51 -
 52
52
 |
 |

LOWE’S 2007 ANNUAL REPORT |43
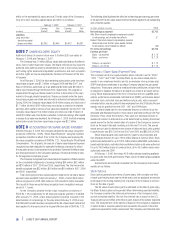
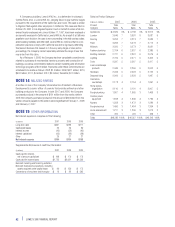
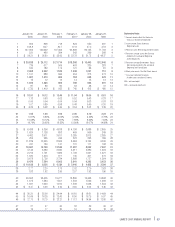
Selected Statement of Earnings Data
(In millions, except per share data) 2007 2006 2005* 2004 2003
Net sales $48,283 $46,927 $43,243 $36,464 $30,838
Gross margin 16,727 16,198 14,790 12,240 9,533
Earnings from continuing operations 2,809 3,105 2,765 2,167 1,807
Earnings from discontinued operations, net of tax – – – – 15
Net earnings 2,809 3,105 2,765 2,167 1,822
Basic earnings per share – continuing operations 1.90 2.02 1.78 1.39 1.15
Basic earnings per share – discontinued operations – – – – 0.01
Basic earnings per share 1.90 2.02 1.78 1.39 1.16
Diluted earnings per share – continuing operations 1.86 1.99 1.73 1.35 1.12
Diluted earnings per share – discontinued operations – – – – 0.01
Diluted earnings per share 1.86 1.99 1.73 1.35 1.13
Dividends per share $ 0.29 $ 0.18 $ 0.11 $ 0.08 $ 0.06
Selected Balance Sheet Data
Total assets $30,869 $27,767 $24,639 $21,101 $18,667
Long-term debt, excluding current maturities $ 5,576 $ 4,325 $ 3,499 $ 3,060 $ 3,678
Note: The selected financial data has been adjusted to present the 2003 disposal of the Contractor Yards as a discontinued operation for all periods.
* Fiscal year 2005 contained 53 weeks, while all other years contained 52 weeks.
Selected Quarterly Data
(In millions, except per share data) First Second Third Fourth
2007
Net sales $12,172 $14,167 $11,565 $10,379
Gross margin 4,259 4,883 3,964 3,620
Net earnings 739 1,019 643 408
Basic earnings per share 0.49 0.68 0.44 0.28
Diluted earnings per share $ 0.48 $ 0.67 $ 0.43 $ 0.28
(In millions, except per share data) First Second Third Fourth
2006
Net sales $11,921 $13,389 $11,211 $10,406
Gross margin 4,169 4,478 3,865 3,687
Net earnings 841 935 716 613
Basic earnings per share 0.54 0.61 0.47 0.40
Diluted earnings per share $ 0.53 $ 0.60 $ 0.46 $ 0.40
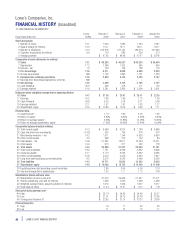
Lowe’s Companies, Inc.
SELECTED FINANCIAL DATA (Unaudited)
Alabama 35
Alaska 4
Arizona 29
Arkansas 20
California 93
Colorado 24
Connecticut 10
Delaware 9
Florida 105
Georgia 61
Hawaii 3
Idaho 8
Illinois 37
Indiana 42
Iowa 11
Kansas 10
Kentucky 41
Louisiana 27
Maine 9
Maryland 26
Massachusetts 22
Michigan 47
Minnesota 12
Mississippi 22
Missouri 40
Montana 5
Nebraska 5
Nevada
16
New Hampshire
11
New Jersey 34
New Mexico 10
New York 51
North Carolina
100
North Dakota
3
Ohio 77
Oklahoma 26
Oregon 12
Pennsylvania
71
Rhode Island 4
South Carolina
42
South Dakota 3
Tennessee 54
Texas 123
Utah 14
Vermont 1
Virginia 57
Washington 33
West Virginia 18
Wisconsin 10
Wyoming 1
Total U.S. Stores 1,528
Ontario
6
Total Stores 1,534
Lowe’s Stores by State and Province
(As of February 1, 2008)