Lowe's 2007 Annual Report Download - page 24
Download and view the complete annual report
Please find page 24 of the 2007 Lowe's annual report below. You can navigate through the pages in the report by either clicking on the pages listed below, or by using the keyword search tool below to find specific information within the annual report.-
 1
1 -
2
-
3
-
4
-
5
-
6
-
7
-
8
-
9
-
10
-
11
-
12
-
13
-
 14
14 -
 15
15 -
 16
16 -
 17
17 -
 18
18 -
 19
19 -
 20
20 -
 21
21 -
 22
22 -
 23
23 -
 24
24 -
 25
25 -
 26
26 -
 27
27 -
 28
28 -
 29
29 -
 30
30 -
 31
31 -
 32
32 -
 33
33 -
 34
34 -
35
-
36
-
37
-
38
-
39
-
40
-
41
-
42
-
43
-
44
-
45
-
46
-
47
-
48
-
49
-
50
-
51
-
52
 |
 |

22 |LOWE’S 2007 ANNUAL REPORT
Our Big 3 Specialty Sales initiatives had mixed results in 2007. Growth in
Installed Sales was 2.8% and growth in Special Order Sales was 0.5% in 2007,
while comparable store sales declined 5.5% for Installed Sales and 8.1% for
Special Order Sales as a result of the weakness in bigger-ticket and more complex
projects. For the year, Installed Sales was approximately 6% of our total sales
and Special Order Sales was approximately 8%. In contrast, total sales growth
for Commercial Business Customers outpaced the company average.
Gross margin
For 2007,gross margin of 34.64% represented a12-basis-point increase over
2006.This increase as a percentage of sales was primarily driven by leverage
of 13 basis points related to positive product mix shifts, 11 basis points related
to increased penetration of imported goods and five basis points of improved
inventory shrink results.This leverage was partially offset by de-leverage of
13 basis points in transportation costs primarily attributable to rising fuel costs,
and seven basis points as a result of start-up costs for new distribution facilities.
SG&A
The increase in SG&A as a percentage of sales from 2006 to 2007 was primarily
driven by de-leverage of 67 basis points in store payroll as a result of the weak
sales environment.As sales per store declined,stores were meeting our minimum
staffing hours threshold which increased the proportion of fixed to total payroll.
Although this creates short-term pressure on earnings, in the long-term it
ensures that we maintain the high service levels that customers have come to
expect from Lowe’s. In addition, we saw de-leverage of eight basis points in
retirement plan expenses as a result of changes to the 401k plan to replace the
performance match program with an increased baseline match.No performance
match was earned in 2006.We also had de-leverage in fixed expenses such as
rent, utilities and property taxes as a result of softer sales.These items were
partially offset by leverage of 23 basis points in advertising expense, primarily
attributable to reduced spending on tab production and distribution, and
national television advertising.
Store opening costs
Store opening costs,which include payroll and supply costs incurred prior to store
opening as well as grand opening advertising costs,totaled $141 million in 2007,
compared to $146 million in 2006.These costs are associated with the opening
of 153 stores in 2007 (149 new and four relocated),as compared with the open-
ing of 155 stores in 2006 (151 new and four relocated).Store opening costs for
stores opened during the year in the U.S.averaged approximately $0.8 million
and $0.9 million per store in 2007 and 2006,respectively.Store opening costs for
stores opened during the year in Canada averaged approximately $2.4 million
per store in 2007 as a result of additional expenses necessary to enter a new
market. Because store opening costs are expensed as incurred, the timing of
expense recognition fluctuates based on the timing of store openings.
Depreciation
Depreciation de-leveraged 35 basis points as a percentage of sales in 2007.
This de-leverage was driven by the opening of 153 stores in 2007 and nega-
tive comparable store sales.Property,less accumulated depreciation, increased
to $21.4 billion at February 1, 2008, compared to $19.0 billion at February 2,
2007.At February 1,2008,we owned 87% of our stores,compared to 86% at
February 2, 2007, which includes stores on leased land.
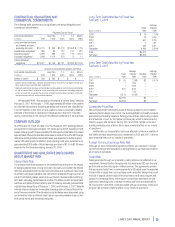
Interest
Net interest expense is comprised of the following:
(In millions) 2007 2006
Interest expense, net of amount capitalized $230 $200
Amortization of original issue discount and loan costs 9 6
Interest income (45) (52)
Net interest expense $194 $154
Interest expense increased primarily as a result of the September 2007
$1.3 billion debt issuance and the October 2006 $1 billion debt issuance,
partially offset by an increase in capitalized interest.
Income tax provision
Our effective income tax rate was 37.7% in 2007 versus 37.9% in 2006.
The decrease in the effective tax rate was due to a continuation of the effect
of increased federal tax credits associated with Welfare to Work and Work
Opportunity Tax Credit programs as well as increased state tax credits
related to our investments in employees and property.
Fiscal 2006 Compared to Fiscal 2005
For the purpose of the following discussion, comparable store sales,comparable
store average ticket and comparable store customer transactions are based
on comparable 52-week periods.
Net sales
Our continued focus on executing the fundamentals and providing customer-
valued solutions together with our store expansion program drove sales of
$46.9 billion in 2006.We opened 155 stores in 2006,including four relocations,
and ended the year with 1,385 stores in 49 states. The additional week in
2005 resulted in approximately $750 million in additional net sales in 2005.
Excluding the additional week, net sales would have increased approximately
10% in 2006.
Comparable store sales were flat in 2006 versus a comparable store sales
increase of 6.1% in 2005. Total customer transactions increased 6.4%
compared to 2005, and average ticket increased 1.9% to $68.98.Average
ticket and customer transactions for comparable stores were relatively flat
versus the prior year.
Sales in many areas of the country were pressured by the slowdown in
the housing market.Markets in the Northeast,Florida and California were most
exposed to the slowdown in housing in 2006 and reduced total company
comparable store sales by approximately 150 basis points for the year. Sales
trends in those markets clearly indicated a cautious home improvement
consumer. Also, areas of the Gulf Coast and Florida, which experienced
increased demand in 2005 related to rebuilding from the hurricanes,experienced
comparable store sales declines of 18.7% in the second half of 2006.
Reflective of the difficult sales environment,11 of our 20 product categories
experienced comparable store sales increases in 2006.The categories that
performed above our average comparable store sales change included rough
plumbing,building materials,rough electrical,home environment,paint,fashion
plumbing, flooring, nursery, seasonal living, and lawn & landscape products.
In addition, hardware performed at approximately our average comparable
store sales change in 2006. Despite the difficult sales environment, we were
able to gain unit market share in all of our 20 product categories versus the
prior calendar year, according to third-party estimates.
Outdoor power equipment and lumber experienced the greatest comparable
store sales declines in 2006. Comparable store generator sales were down
34% for the year, compared to strong sales driven by the 2005 hurricanes.
Additionally, a warmer than normal winter led to comparable store sales declines
for snow throwers. However, despite the difficult sales environment, we
experienced a 2% unit market share gain in outdoor power equipment in
calendar year 2006.Lumber and plywood experienced more than 15% cost
deflation and similar retail price deflation in 2006.
Our Big 3 Specialty Sales initiatives had mixed results in 2006.A hesitation
to take on large projects by some consumers had an impact on our Installed
Sales and Special Order Sales in the second half of 2006. Installed Sales
increased 9% over 2005. Special Order Sales increased 5% over 2005. In
contrast, sales growth for Commercial Business Customers was nearly double
the company average.