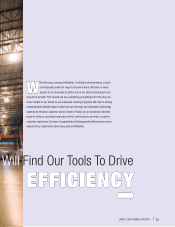
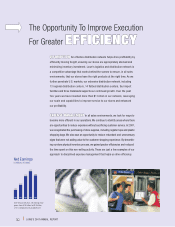
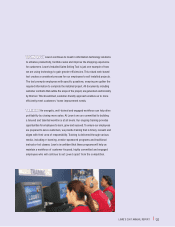
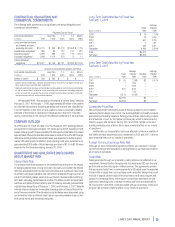
Lowe's 2007 Annual Report Download - page 25
Download and view the complete annual report
Please find page 25 of the 2007 Lowe's annual report below. You can navigate through the pages in the report by either clicking on the pages listed below, or by using the keyword search tool below to find specific information within the annual report.-
 1
1 -
2
-
3
-
4
-
5
-
6
-
7
-
8
-
9
-
10
-
11
-
12
-
13
-
14
-
 15
15 -
 16
16 -
 17
17 -
 18
18 -
 19
19 -
 20
20 -
 21
21 -
 22
22 -
 23
23 -
 24
24 -
 25
25 -
 26
26 -
 27
27 -
 28
28 -
 29
29 -
 30
30 -
 31
31 -
 32
32 -
 33
33 -
 34
34 -
 35
35 -
36
-
37
-
38
-
39
-
40
-
41
-
42
-
43
-
44
-
45
-
46
-
47
-
48
-
49
-
50
-
51
-
52
 |
 |

LOWE’S 2007 ANNUAL REPORT |23
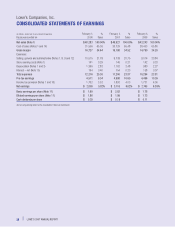
Gross margin
For 2006,gross margin of 34.52% represented a 32-basis-point increase over
2005.This increase as a percentage of sales was primarily due to leverage of
20 basis points related to positive product mix shifts and a greater proportion
of imported goods, which typically have lower acquisition costs. For 2006, we
imported approximately 11% of our goods, compared to approximately 9.5%
in the prior year.These items were slightly offset by de-leverage of nine basis
points in inventory shrink as a percentage of sales.
SG&A
The decrease in SG&A as a percentage of sales from 2005 to 2006 was primarily
due to lower expenses related to bonus and retirement plans.Our performance-
based bonus and retirement expenses fluctuate with our sales and earnings
performance relative to plan, and decreased approximately $200 million, or
50 basis points, in 2006. In addition, insurance expense leveraged 12 basis
points in 2006, a result of our ongoing safety initiatives and the benefits of
regulatory changes in certain states,which contributed to actuarial projections
of lower costs to settle claims.These items were partially offset by de-leverage
in store payroll.As sales slowed throughout the year, our stores adjusted their
hours accordingly. However, because of our base staffing requirements and
customer service standards, we chose not to reduce payroll at the same rate
as sales.
Store opening costs
Store opening costs, which include payroll and supply costs incurred prior to
store opening as well as grand opening advertising costs, totaled $146 million
in 2006, compared to $142 million in 2005.These costs are associated with
the opening of 155 stores in 2006 (151 new and four relocated), as compared
with the opening of 150 stores in 2005 (147 new and three relocated). Store
opening costs for stores opened during the year averaged approximately
$0.9 million per store in 2006 and 2005. Because store opening costs are
expensed as incurred, the timing of expense recognition fluctuates based on
the timing of store openings.
Depreciation
Depreciation de-leveraged 21 basis points as a percentage of sales in 2006.
This de-leverage was driven by growth in assets and the softer sales environment.
At February 2, 2007, we owned 86% of our stores, compared to 84% at
February 3,2006,which includes stores on leased land.Property, less accumu-
lated depreciation, increased to $19.0 billion at February 2, 2007, compared
to $16.4 billion at February 3, 2006.The increase in property resulted primarily
from our store expansion program as well as our remerchandising efforts.
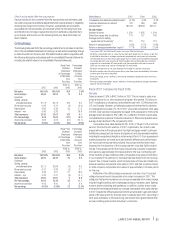
Interest
Net interest expense is comprised of the following:
(In millions) 2006 2005
Interest expense, net of amount capitalized $200 $186
Amortization of original issue discount and loan costs 6 17
Interest income (52) (45)
Net interest expense $154 $158
Interest expense increased primarily due to the October 2006 $1 billion debt
issuance, partially offset by lower interest expense on convertible debt due to
conversions during 2006. Interest expense relating to capital leases was
$34 million for 2006 and$39 millionfor 2005.Amortization of loancostsdecreased
in 2006 versus the prior year as a result of increased debt conversions.
Income tax provision
Our effective income tax rate was 37.9% in 2006 versus 38.5% in 2005.The
decrease in the effective tax rate was the result of increased federal tax credits
associated with Welfare toWork andWork OpportunityTax Credit programs and
increased state tax credits related to our investments in employees and property.
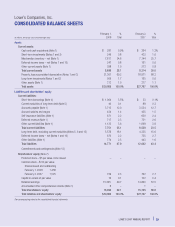
FINANCIAL CONDITION, LIQUIDITY AND
CAPITAL RESOURCES
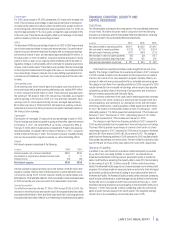
Cash Flows
The following table summarizes the components of the consolidated statements
of cash flows.This table should be read in conjunction with the following
discussion and analysis and the consolidated financial statements, including
the related notes to the consolidated financial statements:
(In millions) 2007 2006 2005
Net cash provided by operating activities $4,347 $4,502 $ 3,842
Net cash used in investing activities (4,123) (3,715) (3,674)
Net cash used in financing activities (307) (846) (275)
Net decrease in cash and cash equivalents (83) (59) (107)
Cash and cash equivalents,beginning of year 364 423 530
Cash and cash equivalents, end of year $ 281 $ 364 $ 423
Cash flows from operating activities provide a significant source of our
liquidity.The change in cash flows from operating activities in 2007 compared
to 2006 resulted primarily from decreased net earnings and an increase in
inventory as a result of our store expansion program, partially offset by an
increase in deferred revenue associated with our extended warranty program.
The change in cash flows from operating activities in 2006 compared to 2005
resulted primarily from increased net earnings and increased days payable
outstanding, partially offset by the timing of tax payments and a decline in
deferred revenue associated with Specialty Sales.
The primary component of net cash used in investing activities continues
to be opening new stores, investing in existing stores through resets and
remerchandising, and investing in our distribution center and information
technology infrastructure. Cash acquisitions of fixed assets were $4.0 billion
for 2007, $3.9 billion in 2006 and $3.4 billion in 2005.The February 1, 2008,
retail selling space of 174 million square feet represented an 11% increase over
February 2, 2007.The February 2, 2007, retail selling space of 157 million
square feet represented a 12% increase over February 3, 2006.
The change in cash flows from financing activities in 2007 compared to
2006 resulted primarily from increased short-term and long-term borrowings.
This was offset by greater repurchases of common stock under our share
repurchase program in 2007 compared to 2006 and an increase in dividends
paid from $0.18 per share in 2006 to $0.29 per share in 2007.The change in
cash flows from financing activities in 2006 compared to 2005 resulted primarily
from greater repurchases of common stock.The ratio of debt to equity plus debt
was 29.3% and 22.0% as of the years ended 2007 and 2006, respectively.
Sources of Liquidity
In addition to our cash flows from operations, additional liquidity is provided
by our short-term borrowing facilities. In June 2007, we entered into an
Amended and Restated Credit Agreement (Amended Facility) to modify the
senior credit facility by extending the maturity date to June 2012 and providing
for borrowings of up to $1.75 billion versus $1.0 billion under the previous
facility.TheAmended Facility supports our commercial paper and revolving credit
programs. Borrowings made are unsecured and are priced at a fixed rate based
upon market conditions at the time of funding in accordance with the terms of
theAmended Facility.TheAmended Facility contains certain restrictive covenants,
which include maintenance of a debt leverage ratio as defined by the Amended
Facility.We were in compliance with those covenants at February 1, 2008.
Seventeen banking institutions are participating in the Amended Facility.As of
February 1, 2008,there was $1.0 billion outstanding under the commercial
paper program that was issued in the fourth quarter. The weighted-average
interest rate on the outstanding commercial paper was 3.92%.