Proctor and Gamble 2006 Annual Report Download - page 2
Download and view the complete annual report
Please find page 2 of the 2006 Proctor and Gamble annual report below. You can navigate through the pages in the report by either clicking on the pages listed below, or by using the keyword search tool below to find specific information within the annual report.-
 1
1 -
 2
2 -
 3
3 -
 4
4 -
 5
5 -
 6
6 -
 7
7 -
 8
8 -
 9
9 -
 10
10 -
 11
11 -
 12
12 -
 13
13 -
14
-
15
-
16
-
17
-
18
-
19
-
20
-
21
-
22
-
23
-
24
-
25
-
26
-
27
-
28
-
29
-
30
-
31
-
32
-
33
-
34
-
35
-
36
-
37
-
38
-
39
-
40
-
41
-
42
-
43
-
44
-
45
-
46
-
47
-
48
-
49
-
50
-
51
-
52
-
53
-
54
-
55
-
56
-
57
-
58
-
59
-
60
-
61
-
62
-
63
-
64
-
65
-
66
-
67
-
68
-
69
-
70
-
71
-
72
 |
 |

Contents
Letter to Shareholders 2
Capability &Opportunity 7
P&G’s Billion-Dollar Brands 16
Financial Contents 21
Corporate Officers 64
Board of Directors 65
Shareholder Information 66
11-Year Financial Summary 67
P&GataGlance 68
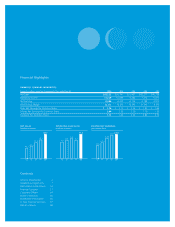
Financial Highlights
FINANCIAL SUMMARY (UNAUDITED)
Amounts in millions, except per share amounts; Years ended June 30 2006 2005 2004 2003 2002
Net Sales $68,222 $56,741 $51,407 $43,377 $40,238
Operating Income 13,249 10,469 9,382 7,312 6,073
Net Earnings 8,684 6,923 6,156 4,788 3,910
Net Earnings Margin 12.7% 12.2% 12.0% 11.0% 9.7%
Basic Net Earnings Per Common Share $2.79 $ 2.70 $ 2.34 $ 1.80 $ 1.46
Diluted Net Earnings Per Common Share 2.64 2.53 2.20 1.70 1.39
Dividends Per Common Share 1.15 1.03 0.93 0.82 0.76
NET SALES
(in billions of dollars)
04
4
0
4 4
006
68.2
0
40
DILUTED NET EARNINGS
(per common share)
040
0
006
2.64
0
0
OPERATING CASH FLOW
(in billions of dollars)
040
4
06
11.4
0 0