Proctor and Gamble 2006 Annual Report Download - page 64
Download and view the complete annual report
Please find page 64 of the 2006 Proctor and Gamble annual report below. You can navigate through the pages in the report by either clicking on the pages listed below, or by using the keyword search tool below to find specific information within the annual report.-
 1
1 -
2
-
3
-
4
-
5
-
6
-
7
-
8
-
9
-
10
-
11
-
12
-
13
-
14
-
15
-
16
-
17
-
18
-
19
-
20
-
21
-
22
-
23
-
24
-
25
-
26
-
27
-
28
-
29
-
30
-
31
-
32
-
33
-
34
-
35
-
36
-
37
-
38
-
39
-
40
-
41
-
42
-
43
-
44
-
45
-
46
-
47
-
48
-
49
-
50
-
51
-
52
-
53
-
 54
54 -
 55
55 -
 56
56 -
 57
57 -
 58
58 -
 59
59 -
 60
60 -
 61
61 -
 62
62 -
 63
63 -
 64
64 -
 65
65 -
 66
66 -
 67
67 -
 68
68 -
 69
69 -
 70
70 -
 71
71 -
 72
72
 |
 |

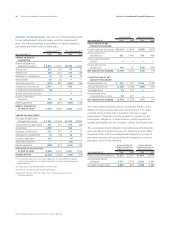
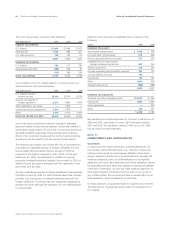
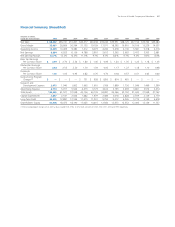
Millions of dollars except per share amounts or otherwise specified.
Notes to Consolidated Financial Statements
The Procter &Gamble Company and Subsidiaries
62
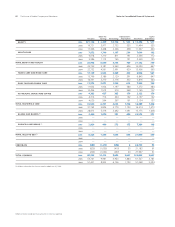
Before-Tax Depreciation &Capital
Net Sales Earnings Net Earnings Amortization Total Assets Expenditures
BEAUTY 2006 $21,126 $ 4,359 $3,106 $ 535 $ 13,498 $ 577
2005 19,721 3,977 2,752 535 11,494 535
2004 17,346 3,448 2,246 498 11,547 440
HEALTH CARE 2006 7,852 1,740 1,167 234 7,644 162
2005 6,078 1,210 811 161 2,536 112
2004 5,386 1,113 745 131 2,359 125
TOTAL BEAUTY AND HEALTH 2006 28,978 6,099 4,273 769 21,142 739
2005 25,799 5,187 3,563 696 14,030 647
2004 22,732 4,561 2,991 629 13,906 565
FABRIC CARE AND HOME CARE 2006 17,149 3,553 2,369 435 6,928 567
2005 15,796 3,186 2,129 391 6,845 647
2004 14,361 3,270 2,176 352 5,876 544
BABY CARE AND FAMILY CARE 2006 11,972 2,071 1,299 612 7,339 739
2005 11,652 1,924 1,197 580 7,272 684
2004 10,494 1,512 919 548 7,145 707
PET HEALTH, SNACKS AND COFFEE 2006 4,383 627 385 159 2,122 150
2005 4,314 714 444 162 2,197 142
2004 4,020 594 367 161 2,154 157
TOTAL HOUSEHOLD CARE 2006 33,504 6,251 4,053 1,206 16,389 1,456
2005 31,762 5,824 3,770 1,133 16,314 1,473
2004 28,875 5,376 3,462 1,061 15,175 1,408
BLADES AND RAZORS (1) 2006 3,499 1,076 781 489 24,575 271
2005 ——————
2004 ——————
DURACELL AND BRAUN(1) 2006 2,924 400 273 155 7,384 108
2005 ——————
2004 ——————
TOTAL GILLETTE GBU (1) 2006 6,423 1,476 1,054 644 31,959 379
2005 ——————
2004 ——————
CORPORATE 2006 (683) (1,413) (696) 8 66,205 93
2005 (820) (1,030) (410) 55 31,183 61
2004 (200) (1,032) (297) 43 27,967 51
TOTAL COMPANY 2006 68,222 12,413 8,684 2,627 135,695 2,667
2005 56,741 9,981 6,923 1,884 61,527 2,181
2004 51,407 8,905 6,156 1,733 57,048 2,024
(1) Reflects information for the nine months ended June 30, 2006.