Proctor and Gamble 2006 Annual Report Download - page 31
Download and view the complete annual report
Please find page 31 of the 2006 Proctor and Gamble annual report below. You can navigate through the pages in the report by either clicking on the pages listed below, or by using the keyword search tool below to find specific information within the annual report.-
 1
1 -
2
-
3
-
4
-
5
-
6
-
7
-
8
-
9
-
10
-
11
-
12
-
13
-
14
-
15
-
16
-
17
-
18
-
19
-
20
-
 21
21 -
 22
22 -
 23
23 -
 24
24 -
 25
25 -
 26
26 -
 27
27 -
 28
28 -
 29
29 -
 30
30 -
 31
31 -
 32
32 -
 33
33 -
 34
34 -
 35
35 -
 36
36 -
 37
37 -
 38
38 -
 39
39 -
 40
40 -
 41
41 -
42
-
43
-
44
-
45
-
46
-
47
-
48
-
49
-
50
-
51
-
52
-
53
-
54
-
55
-
56
-
57
-
58
-
59
-
60
-
61
-
62
-
63
-
64
-
65
-
66
-
67
-
68
-
69
-
70
-
71
-
72
 |
 |

The Procter &Gamble Company and Subsidiaries 29Management’s Discussion and Analysis
RESULTS OF OPERATIONS
Volume and Net Sales
Unit volume in 2006 increased 19%, including the impact of adding
the Gillette business on October 1, 2005. Organic volume, which
excludes the impact of acquisitions and divestitures, increased 6%.
Each geographic region posted organic volume growth, led by double-
digit growth in developing regions. The increase in organic volume
was driven by:
•High-single digit organic volume growth of our “billion-dollar brand”
portfolio.
•Organic volume growth in each of our top 16 countries.
representing approximately 80% of total Company net sales.
•Mid-single digit or higher organic volume growth in all but one of
our segments.
•Strength in developing markets where organic volume increased
double-digits.
Net sales in 2006 were $68.22 billion, an increase of 20% versus the
prior year, including the impact of adding the Gillette business. Foreign
exchange had a negative 1% impact on net sales growth, primarily
due to the strengthening of the U.S. dollar relative to the euro, British
pound and Japanese yen. Pricing increases taken across most of our
business segments, primarily to offset increased commodity costs,
added 1% to sales growth. A more premium product mix, driven in
part by the addition of the Gillette business, more than offset the mix
impact of disproportionate growth in developing markets, where the
average unit sales price is lower than the Company average. This resulted
in a positive mix impact of 1% on net sales growth. Organic sales
increased 7% versus the prior year.
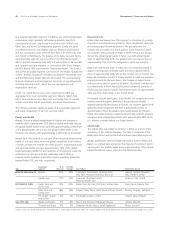
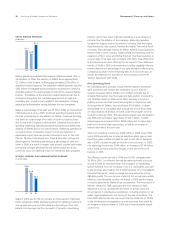
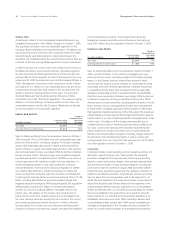
NET SALES
(in billions of dollars)
05
56.7
04
51.4
06
6
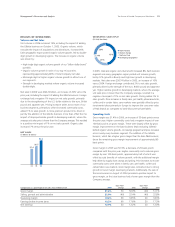
GEOGRAPHIC SALES SPLIT
(FY 2006 Net Sales)
In 2005, total and organic unit volume both increased 8%. Each business
segment and every geographic region posted unit volume growth,
led by 12% growth in Beauty and high-teen growth in developing
markets. Net sales were $56.74 billion in 2005, an increase of 10%
versus 2004. Foreign exchange contributed 2% to net sales growth,
primarily driven by the strength of the euro, British pound and Japanese
yen. Higher relative growth in developing markets, where the average
unit sales price is lower than the Company average, resulted in a
negative mix impact of 1% on net sales growth. Pricing added 1% to
sales growth. Price increases in family care, pet health, pharmaceuticals,
coffee and in certain fabric care markets were partially offset by price
investments taken primarily in Europe to improve the consumer value
of P&G brands as compared to hard-discounter private labels.
Operating Costs
Gross margin was 51.4% in 2006, an increase of 50-basis points versus
the prior year. Higher commodity costs had a negative impact of over
100-basis points on gross margin. These were largely offset by gross
margin improvement on the base business (P&G excluding Gillette)
behind organic volume growth, cost savings programs and price increases
across nearly every business segment. The addition of the Gillette
business, which has a higher gross margin than the base P&Gbusiness,
drove the remaining gross margin improvement of approximately 80-
basis points.
Gross margin in 2005 was 50.9%, a decrease of 20-basis points
compared with the prior year. Higher commodity costs reduced gross
margin by over 100-basis points, approximately half of which was
offset by scale benefits of volume growth, with the additional margin
help driven by supply chain savings and pricing. Price increases to recover
commodity costs were taken in family care, pet health, coffee and
certain fabric care markets. Gross margin also contracted due to strong
growth in lower margin developing markets. Additionally, the sale of
the Juice business in August of 2004 provided a positive impact to
gross margin, as the Juice business had a lower gross margin than the
Company average.
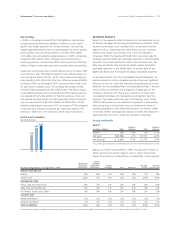
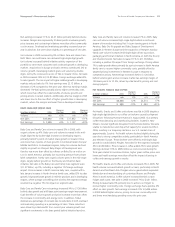
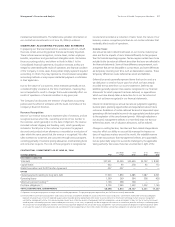
Basis Point Basis Point
Comparisons as a percentage of net sales; Years ended June 30 2006 Change 2005 Change 2004
Gross margin 51.4% 50 50.9% (20) 51.1%
Selling, general and administrative 32.0% (40) 32.4% (40) 32.8%
Operating margin 19.4% 90 18.5% 20 18.3%
Earnings before income taxes 18.2% 60 17.6% 30 17.3%
Net earnings 12.7% 50 12.2% 20 12.0%
4% 47%
23%
26% North America
Western Europe
Northeast Asia
Developing Geographies