Proctor and Gamble 2006 Annual Report Download - page 47
Download and view the complete annual report
Please find page 47 of the 2006 Proctor and Gamble annual report below. You can navigate through the pages in the report by either clicking on the pages listed below, or by using the keyword search tool below to find specific information within the annual report.-
 1
1 -
2
-
3
-
4
-
5
-
6
-
7
-
8
-
9
-
10
-
11
-
12
-
13
-
14
-
15
-
16
-
17
-
18
-
19
-
20
-
21
-
22
-
23
-
24
-
25
-
26
-
27
-
28
-
29
-
30
-
31
-
32
-
33
-
34
-
35
-
36
-
 37
37 -
 38
38 -
 39
39 -
 40
40 -
 41
41 -
 42
42 -
 43
43 -
 44
44 -
 45
45 -
 46
46 -
 47
47 -
 48
48 -
 49
49 -
 50
50 -
 51
51 -
 52
52 -
 53
53 -
 54
54 -
 55
55 -
 56
56 -
 57
57 -
58
-
59
-
60
-
61
-
62
-
63
-
64
-
65
-
66
-
67
-
68
-
69
-
70
-
71
-
72
 |
 |

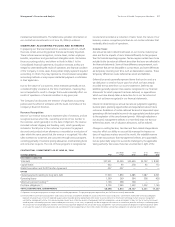
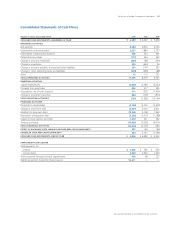
The Procter &Gamble Company and Subsidiaries 45
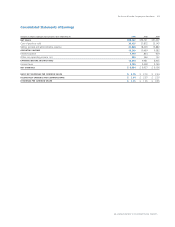
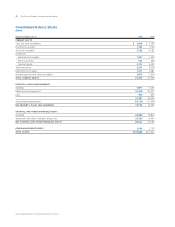
See accompanying Notes to Consolidated Financial Statements.
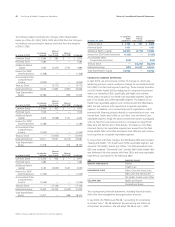
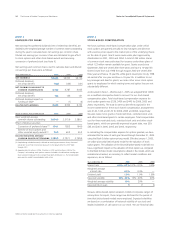
Consolidated Statements of Cash Flows
Amounts in millions; Years ended June 30 2006 2005 2004
CASH AND CASH EQUIVALENTS, BEGINNING OF YEAR $ 6,389 $ 4,232 $ 5,428
OPERATING ACTIVITIES
Net earnings 8,684 6,923 6,156
Depreciation and amortization 2,627 1,884 1,733
Share-based compensation expense 585 524 491
Deferred income taxes (112) 564 342
Change in accounts receivable (524) (86) (159)
Change in inventories 383 (644) 56
Change in accounts payable, accrued and other liabilities 230 (101) 597
Change in other operating assets and liabilities (508) (498) (88)
Other 10 113 227
TOTAL OPERATING ACTIVITIES 11,375 8,679 9,355
INVESTING ACTIVITIES
Capital expenditures (2,667) (2,181) (2,024)
Proceeds from asset sales 882 517 230
Acquisitions, net of cash acquired 171 (572) (7,476)
Change in investment securities 884 (100) (874)
TOTAL INVESTING ACTIVITIES (730) (2,336) (10,144)
FINANCING ACTIVITIES
Dividends to shareholders (3,703) (2,731) (2,539)
Change in short-term debt (8,627) 2,016 4,911
Additions to long-term debt 22,545 3,108 1,963
Reductions of long-term debt (5,282) (2,013) (1,188)
Impact of stock options and other 1,319 521 562
Treasury purchases (16,830) (5,026) (4,070)
TOTAL FINANCING ACTIVITIES (10,578) (4,125) (361)
EFFECT OF EXCHANGE RATE CHANGES ON CASH AND CASH EQUIVALENTS 237 (61) (46)
CHANGE IN CASH AND CASH EQUIVALENTS 304 2,157 (1,196)
CASH AND CASH EQUIVALENTS, END OF YEAR $ 6,693 $ 6,389 $ 4,232
SUPPLEMENTAL DISCLOSURE
Cash payments for:
Interest $ 1,045 $ 783 $ 630
Income taxes 2,869 2,644 1,634
Assets acquired through noncash capital leases 363 68 127
Gillette acquisition funded by share issuance 53,371 ——