Proctor and Gamble 2006 Annual Report Download - page 37
Download and view the complete annual report
Please find page 37 of the 2006 Proctor and Gamble annual report below. You can navigate through the pages in the report by either clicking on the pages listed below, or by using the keyword search tool below to find specific information within the annual report.-
 1
1 -
2
-
3
-
4
-
5
-
6
-
7
-
8
-
9
-
10
-
11
-
12
-
13
-
14
-
15
-
16
-
17
-
18
-
19
-
20
-
21
-
22
-
23
-
24
-
25
-
26
-
 27
27 -
 28
28 -
 29
29 -
 30
30 -
 31
31 -
 32
32 -
 33
33 -
 34
34 -
 35
35 -
 36
36 -
 37
37 -
 38
38 -
 39
39 -
 40
40 -
 41
41 -
 42
42 -
 43
43 -
 44
44 -
 45
45 -
 46
46 -
 47
47 -
48
-
49
-
50
-
51
-
52
-
53
-
54
-
55
-
56
-
57
-
58
-
59
-
60
-
61
-
62
-
63
-
64
-
65
-
66
-
67
-
68
-
69
-
70
-
71
-
72
 |
 |
The Procter &Gamble Company and Subsidiaries 35Management’s Discussion and Analysis
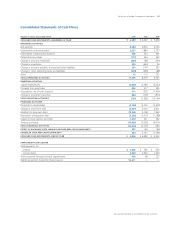
purposes. This means our segment results recognize 100% of each
income statement component through before-tax earnings in the
segments, with eliminations for unconsolidated entities in Corporate. In
determining segment net earnings, we apply the statutory tax rates
(with adjustments to arrive at the Company’s effective tax rate in
Corporate) and eliminate the share of earnings applicable to other
ownership interests, in a manner similar to minority interest.
Corporate net sales primarily reflect the adjustment to eliminate the
sales of unconsolidated entities included in business unit results. Net
earnings in the Corporate segment declined by $286 million primarily
due to an increase in net interest expense as a result of increased debt
levels during the year to fund the share repurchase program announced
in conjunction with the Gillette acquisition. In addition, the year-on-
year earnings trend was impacted by the base period gain on the sale
of the Juice business. In 2005, Corporate net earnings declined versus
2004 due to higher interest expense, partially offset by the gain from
the Juice business divestiture.
FINANCIAL CONDITION
We believe our financial condition continues to be of high quality, as
evidenced by our ability to generate substantial cash from operations
and ready access to capital markets at competitive rates.
Operating cash flow provides the primary source of funds to finance
operating needs and capital expenditures. Excess operating cash is
used first to fund shareholder dividends. Other discretionary uses
include share repurchases and “tack-on” acquisitions to complement
our portfolio of brands and geographies. As necessary, we may
supplement operating cash flow with debt to fund these activities.
The overall cash position of the Company reflects our strong business
results and a global cash management strategy that takes into account
liquidity management, economic factors and tax considerations.
Operating Activities
Operating cash flow in 2006 was $11.38 billion compared to $8.68 billion
in 2005, an increase of 31%. Cash flow increased versus the prior year
largely as a result of higher earnings, including the benefit of adding
Gillette. Net earnings, adjusted for non-cash items (primarily depreciation,
amortization, share-based compensation and deferred income taxes),
was the primary source of operating cash flow during the fiscal year.
Working capital was a net source of cash in 2006. We define working
capital as the combination of inventory, accounts receivable and
accounts payable. Improvements in inventory and accounts payable
more than offset an increase in accounts receivable. Inventory days on
our base business were down approximately 8 days year-on-year as the
impact of higher commodities was more than offset by a reduction in
year-on-year inventory levels. Accounts receivable and accounts
payable increased during 2006 primarily to support business growth.
In 2005, operating cash flow was $8.68 billion compared to
$9.36 billion in 2004. The benefit of higher net earnings was more
than offset by changes in working capital and tax payments related
to the settlement of prior year audits.
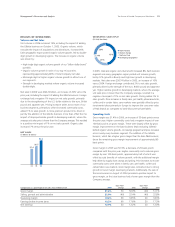
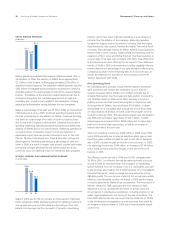
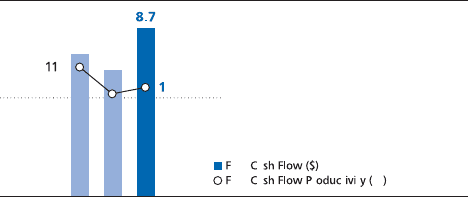
Free Cash Flow. We view free cash flow as an important measure
because it is one factor impacting the amount of cash available for
dividends and discretionary investment. It is defined as operating cash
flow less capital expenditures and is one of the measures used to
evaluate senior management and determine their at-risk compensation.
In 2006, free cash flow was $8.71 billion compared to $6.50 billion in
2005. Free cash flow increased as a result of higher operating cash flow.
Capital expenditures increased in 2006 versus 2005, but remained in
line with the prior year at 3.9% of net sales. Free cash flow productivity,
defined as the ratio of free cash flow to net earnings, was 100% in
2006, ahead of the Company’s 90% target.
In 2005, free cash flow was $6.50 billion compared to $7.33 billion
in 2004. In addition to lower operating cash flow, free cash flow
declined year-over-year due to higher capital expenditures in 2005.
Free cash flow productivity was 94% in 2005.
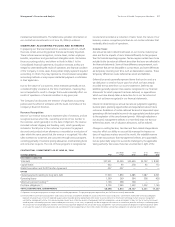
FREE CASH FLOW AND FREE CASH FLOW PRODUCTIVITY
(in billions of dollars, and as a % of net earnings)
Target 90%
05
6.5
04
7.3
06
9
94
00
ree a
ree a r t t %
Investing Activities
Net investing activities in the current year used $730 million of cash
compared to $2.34 billion of cash in the prior year. Investing cash
outflows declined, despite the increase in the level of capital expenditures,
primarily due to cash balances received in the Gillette acquisition,
representing Gillette’s cash balances at the acquisition date. Current
year investing activities also benefited from the maturity of certain
investment securities that were converted to cash equivalents.
Acquisitions. Acquisitions were a net source of cash of $171 million
during 2006, as $1.60 billion of cash balances received in the Gillette
acquisition were partially offset by cash used for other acquisitions.
During 2006, we settled a major portion of the Wella Domination and
Profit Transfer Agreement liability, which was initially created in June
2004 when we completed a Domination and Profit Transfer Agreement
with Wella shareholders. Cash was also used in 2006 for several minor
acquisitions in fabric care, health care and Duracell and for licensing
agreements with Dolce &Gabbana and Gucci. In 2005, acquisitions
used $572 million of cash including the acquisition of a pharmaceuticals
business in Spain, fabric care businesses in Europe and Latin America
and increased investment in our Glad venture with The Clorox Company.