Proctor and Gamble 2006 Annual Report Download - page 34
Download and view the complete annual report
Please find page 34 of the 2006 Proctor and Gamble annual report below. You can navigate through the pages in the report by either clicking on the pages listed below, or by using the keyword search tool below to find specific information within the annual report.-
 1
1 -
2
-
3
-
4
-
5
-
6
-
7
-
8
-
9
-
10
-
11
-
12
-
13
-
14
-
15
-
16
-
17
-
18
-
19
-
20
-
21
-
22
-
23
-
 24
24 -
 25
25 -
 26
26 -
 27
27 -
 28
28 -
 29
29 -
 30
30 -
 31
31 -
 32
32 -
 33
33 -
 34
34 -
 35
35 -
 36
36 -
 37
37 -
 38
38 -
 39
39 -
 40
40 -
 41
41 -
 42
42 -
 43
43 -
 44
44 -
45
-
46
-
47
-
48
-
49
-
50
-
51
-
52
-
53
-
54
-
55
-
56
-
57
-
58
-
59
-
60
-
61
-
62
-
63
-
64
-
65
-
66
-
67
-
68
-
69
-
70
-
71
-
72
 |
 |

The Procter &Gamble Company and Subsidiaries
32 Management’s Discussion and Analysis
was broad-based and was driven by initiative activity including Pantene
Color Expressions, Head &Shoulders brand restage, Olay Regenerist,
Olay Total Effects, Olay Ribbons and the Always pads upgrade. Growth
was also driven by continued expansion of our brands in developing
regions, where volume increased double-digits during the year. Hair
care unit volume increased in the high-single digits behind growth on
Pantene, Head &Shoulders and Rejoice. Skin care unit volume increased
double-digits behind continued growth and initiative activity on the
Olay brand. Feminine care unit volume grew high-single digits behind
new product innovations on Always/Whisper and continued growth
on Naturella. Cosmetics volume declined due to reduced Max Factor
distribution and a base period on Cover Girl with significant initiative
pipeline shipments. Beauty net sales increased 7% to $21.13 billion in
2006, including a negative 1% foreign exchange impact. Organic sales,
which exclude the impacts of acquisitions, divestitures and foreign
exchange, increased 6%.
Net earnings increased 13% to $3.11 billion driven by sales growth
and a 75-basis point net earnings margin expansion primarily related
to lower overhead spending as a percentage of net sales. Margin
improvements from scale benefits of volume growth and manufacturing
cost savings initiatives offset higher commodity costs. Total marketing
spendingonthebaseP
&G business increased year-on-year to support
initiative activity, but was in line with the prior year as a percentage of
net sales.
Beauty unit volume in 2005 increased 12%, while organic volume
increased 8%. Volume growth was driven by double-digit increases in
hair care, skin care and feminine care. Net sales increased 14% to
$19.72 billion in 2005. Foreign exchange contributed 3% to sales growth,
while the mix impact of higher relative growth in developing markets
reduced sales by 1%. Net earnings increased 23% to $2.75 billion
due to volume growth and an after-tax margin improvement of 100-
basis points compared to the prior year. Margin increased primarily
duetothescalebenefitsofvolumegrowth,costreductionprograms
and the impacts of the Company’s increased ownership of the China
operation and the Domination and Profit Transfer Agreement with Wella.
These margin benefits were partially offset by marketing spending to
support initiatives, primarily on the Olay and Pantene franchises.
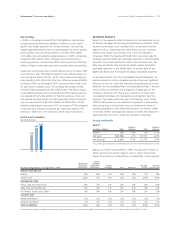
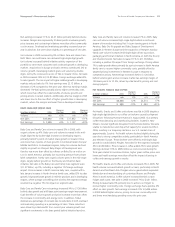
HEALTH CARE
Change vs. Change vs.
(in millions of dollars) 2006 Prior Year 2005 Prior Year
Volume*n/a +26% n/a +12%
Net Sales*$7,852 +29% $6,078 +13%
Net Earnings*$1,167 +44% $ 811 +9%
* Fiscal 2006 figures include results of Gillette oral care for the 9 months ended June 30, 2006.
Health Care unit volume increased 26% in 2006, including nine months
of Gillette oral care results. Organic volume, which excludes the impacts
of acquisitions and divestitures, increased 7%. Pharmaceuticals and
personal health volume increased high-single digits behind double-
digit growth on Prilosec OTC and Actonel. Prilosec OTC volume increased
as a result of market share growth and a suppressed base period
which included several months of shipment allocations. Prilosec OTC
market share increased by approximately 7 points in the U.S. to 38%.
Oral care organic volume grew mid-single digits as a result of market
share increases across the globe, especially in the U.S. and in Central
and Eastern Europe. Our market share increased by more than 1 point
in U.S. toothpaste and on Oral-B toothbrushes to 36% and 37%,
respectively. Net sales in Health Care grew 29% to $7.85 billion, including
nine months of Gillette oral care sales and a negative 1% foreign
exchange impact. Price increases, primarily on Actonel and Prilosec
OTC, added 2% to sales growth. In addition, favorable product mix,
including the addition of the Gillette oral care business, added 2% to
sales growth. Organic sales, which exclude the impacts of acquisitions,
divestitures and foreign exchange, increased 9%.
Net earnings increased 44% to $1.17 billion behind sales growth and
a 150-basis point earnings margin expansion. Net earnings margin
expanded primarily due to lower overhead and marketing spending
as a percentage of net sales. Overhead and marketing spending as a
percentage of net sales were down as a result of scale advantages
from volume growth and the impacts of price increases.
Health Care unit volume in 2005 increased 12% behind double-digit
growth of Prilosec OTC, Actonel and developing markets. Oral care
volume was up mid-single digits as double-digit growth in developing
regions offset a decline in developed regions. Net sales increased
13% to $6.08 billion aided by a positive 2% foreign exchange impact.
Pricing in pharmaceuticals added 1% to sales, while product mix
reduced sales by 2% due to the shift of Macrobid branded sales to
generic sales and higher relative growth in developing markets.
Health Care net earnings in 2005 were $811 million, an increase of
9%. Earnings increased primarily behind volume growth. After-tax
earnings margin declined 50-basis points year-over-year due, in part,
to product mix impacts of lower volume in Macrobid and Crest
Whitestrips, both of which have higher margins than the balance of
the Health Care business. Earnings were also negatively impacted by
a higher royalty expense rate for Prilosec OTC, higher commodity
costs and marketing investments in support of initiatives.
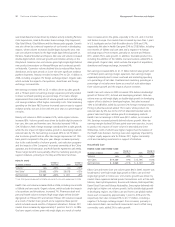
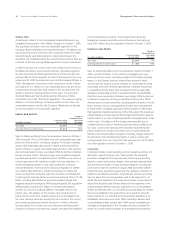
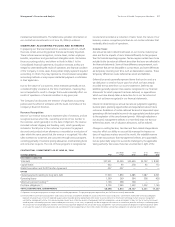
Household Care
FABRIC CARE AND HOME CARE
Change vs. Change vs.
(in millions of dollars) 2006 Prior Year 2005 Prior Year
Volume n/a +8% n/a +9%
Net Sales $17,149 +9% $15,796 +10%
Net Earnings $ 2,369 +11% $ 2,129 -2%
Fabric Care and Home Care unit volume grew 8% in 2006. Growth was
broad-based, with high-single digit growth in fabric care and mid-
single digit growth in home care. Unit volume growth was driven by
market share expansion behind product innovations such as Tide with
Febreze, Gain Joyful Expressions, Bounce with Febreze, Bold Liquid Tabs,
Dawn Direct Foam and Febreze Noticeables. Every region delivered mid-
single digit or higher unit volume growth, led by double-digit growth
in developing regions. Our fabric care and home care global market
shares each increased by approximately 1 point to 33% and 21%,
respectively. Net sales increased 9% to $17.15 billion, including a
negative 1% foreign exchange impact. Price increases, primarily in
Latin America fabric care and North America dish care to offset rising
commodity costs, added 2% to sales growth.