Proctor and Gamble 2006 Annual Report Download - page 32
Download and view the complete annual report
Please find page 32 of the 2006 Proctor and Gamble annual report below. You can navigate through the pages in the report by either clicking on the pages listed below, or by using the keyword search tool below to find specific information within the annual report.-
 1
1 -
2
-
3
-
4
-
5
-
6
-
7
-
8
-
9
-
10
-
11
-
12
-
13
-
14
-
15
-
16
-
17
-
18
-
19
-
20
-
21
-
 22
22 -
 23
23 -
 24
24 -
 25
25 -
 26
26 -
 27
27 -
 28
28 -
 29
29 -
 30
30 -
 31
31 -
 32
32 -
 33
33 -
 34
34 -
 35
35 -
 36
36 -
 37
37 -
 38
38 -
 39
39 -
 40
40 -
 41
41 -
 42
42 -
43
-
44
-
45
-
46
-
47
-
48
-
49
-
50
-
51
-
52
-
53
-
54
-
55
-
56
-
57
-
58
-
59
-
60
-
61
-
62
-
63
-
64
-
65
-
66
-
67
-
68
-
69
-
70
-
71
-
72
 |
 |
The Procter &Gamble Company and Subsidiaries
30 Management’s Discussion and Analysis
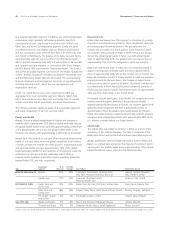
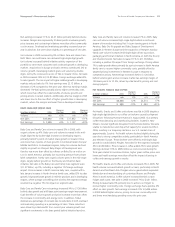
GROSS MARGIN PROGRESS
(% of sales)
05
50.9
04
51.1
06
Selling, general and administrative expense (SG&A) increased 19%, or
$3.45 billion, in 2006. The addition of Gillette drove approximately
$3.1 billion of the increase, including approximately $570 million of
acquisition-related expenses. The acquisition-related expenses included
$352 million of intangible asset amortization resulting from revaluing
intangible assets in the opening balance sheet of the acquired Gillette
business. The balance of the acquisition-related expenses was due to
incremental integration and overhead expenses such as legal and
consulting fees, as well as costs related to the elimination of selling,
general and administrative overlap between the two companies.
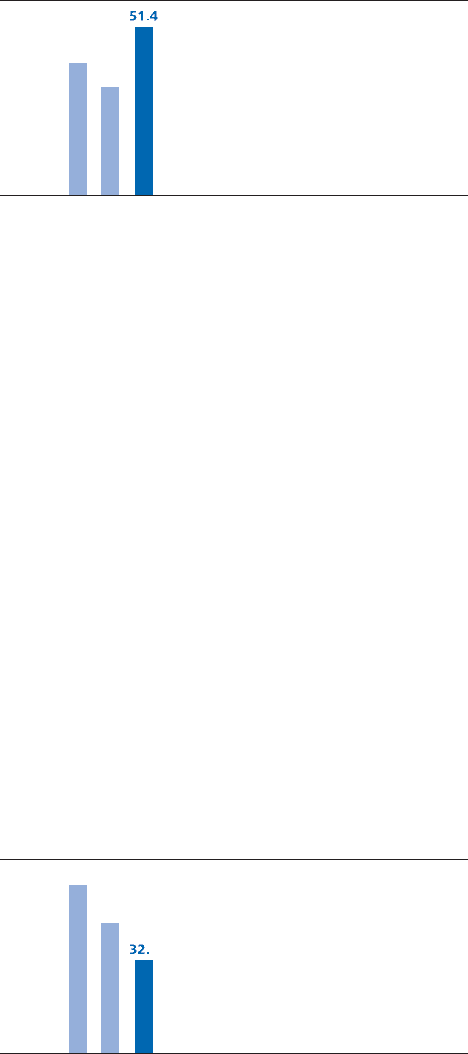
SG&A as a percentage of net sales was 32.0% in 2006, an improvement
of 40-basis points versus 2005. Overhead spending increased during
the year, primarily due to the addition of Gillette. Overhead spending
was down as a percentage of net sales on both our base business
and for the total Company as sales growth outpaced the increase in
spending. Marketing spending increased during the year behind the
addition of Gillette and on our base business. Marketing spending on
our base business increased to support continued expansion in
developing regions and new product innovations such as Tide with
Febreze, Pantene Color Expressions, Head &Shoulders restage and
Olay Regenerist. Marketing spending as a percentage of sales was
lower in 2006 as a result of organic sales growth coupled with media
purchasing synergies generated by the Gillette acquisition and a
continued focus on marketing return-on-investment (ROI) programs.
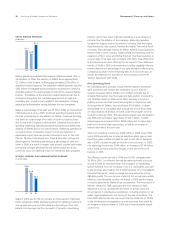
SELLING, GENERAL AND ADMINISTRATIVE EXPENSE
(% of net sales)
05
32.4
04
32.8
06
0
SG&A in 2005 was 32.4% of net sales, an improvement of 40-basis
points compared to 2004. Absolute spending for marketing investments
was up year-over-year, but decreased as a percentage of net sales
behind scale leverage and the mix impact of growth in developing
markets, which have lower marketing spending as a percentage of
net sales than the balance of the Company. Marketing spending
increased to support product innovations including Olay Anti-Aging,
Olay Moisturinse, Olay Quench, Pantene Pro-Health, Tide with a Touch
of Downy, Tide Coldwater, Febreze Air Effects, Pantene Color Expressions,
Pampers Feel ’n Learn, Kandoo Toddler Wipes and Handsoap and the
expansion of SK-II, Lenor and Herbal Essences. Overhead spending as
a percentage of net sales was consistent with 2004. Scale efficiencies
in the base business were offset by the mix impact of two additional
months of Wella in 2005 and investments in selling capability. Minority
interest expense as a percentage of net sales decreased reflecting the
Company’s purchase of the remaining stake in its China venture, as
well as the settlement of a portion of the Domination and Profit
Transfer Agreement with Wella.
Non-Operating Items
Non-operating items primarily include interest expense, divestiture
gains and losses and interest and investment income. Interest
expense increased 34% in 2006 to $1.12 billion primarily due to
increased borrowings. Our fiscal year-end debt position increased by
$13.78 billion dollars in 2006 versus 2005, primarily to fund the
publicly-announced share repurchase program in conjunction with
the acquisition of Gillette. We repurchased $16.8 billion of shares
during 2006. On a cumulative basis through the end of fiscal 2006,
we repurchased $19.8 billion of shares under this program since its
inception in January 2005. The repurchase program was completed in
July 2006 with cumulative repurchases of $20.1 billion. In 2005,
interest expense increased 33% to $834 million due to higher debt
balances to finance share repurchases, as well as an increase in
interest rates versus the prior year.
Other non-operating income was $283 million in 2006, down 18%
versus 2005 primarily due to reduced divestiture gains year-on-year.
Divestiture gains in 2006 included the gain on the sale of Spinbrush
and in 2005 included the gain of the sale of Juice business. In 2005,
non-operating income was $346 million, an increase of $194 million
versus 2004, primarily driven by the gain on the sale of the Juice
business in 2005.
The effective income tax rate in 2006 was 30.0%, compared with
30.6% in 2005. Our effective tax rate decreased primarily due to an
accrual in 2005 for estimated taxes in anticipation of repatriating
special dividends from the Company’s non-U.S. subsidiaries, pursuant
to the American Jobs Creation Act of 2004 (see Note 10 to Consolidated
Financial Statements), which increased the base period tax rate by
280-basis points. The year-on-year impact of this accrual was partially
offset by a less favorable country mix impact in 2006 and the impact
of reserve adjustments related to tax uncertainties. The net amount of
reserves released in 2006 was below the level released in 2005.
Adjustments for tax uncertainties are based on specific facts and
circumstances in individual tax jurisdictions, including progress on tax
audits, legal developments and closing of statutes of limitation. The
fiscal 2005 effective tax rate was lower than the 2004 rate of 30.9%
as the aforementioned repatriation accrual was more than offset by
an increase in reserve releases in 2005 and a more favorable overall
country mix.