Starbucks 2002 Annual Report Download - page 10
Download and view the complete annual report
Please find page 10 of the 2002 Starbucks annual report below. You can navigate through the pages in the report by either clicking on the pages listed below, or by using the keyword search tool below to find specific information within the annual report.-
 1
1 -
 2
2 -
 3
3 -
 4
4 -
 5
5 -
 6
6 -
 7
7 -
 8
8 -
 9
9 -
 10
10 -
 11
11 -
 12
12 -
 13
13 -
 14
14 -
 15
15 -
 16
16 -
 17
17 -
 18
18 -
 19
19 -
 20
20 -
 21
21 -
22
-
23
-
24
-
25
-
26
 |
 |

24
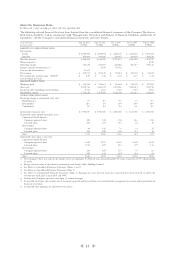
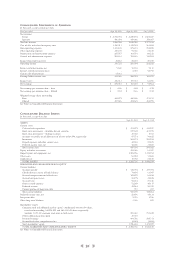
CONSOLIDATED STATEMENTS OF EARNINGS
In thousands, except earnings per share
Fiscal year ended Sept 29, 2002 Sept 30, 2001 Oct 1, 2000
Net revenues:
Retail $2,792,904 $ 2,229,594 $ 1,823,607
Specialty 496,004 419,386 354,007
Total net revenues 3,288,908 2,648,980 2,177,614
Cost of sales and related occupancy costs 1,350,011 1,112,785 961,885
Store operating expenses 1,121,108 875,473 704,898
Other operating expenses 127,178 93,326 78,445
Depreciation and amortization expenses 205,557 163,501 130,232
General and administrative expenses 202,161 151,416 110,202
Income from equity investees 35,832 28,615 20,300
Operating income 318,725 281,094 212,252
Interest and other income, net 9,300 10,768 7,110
Internet-related investment losses - 2,940 58,792
Gain on sale of investment 13,361 - -
Earnings before income taxes 341,386 288,922 160,570
Income taxes 126,313 107,712 66,006
Net earnings $215,073 $ 181,210 $ 94,564
Net earnings per common share – basic $ 0.56 $ 0.48 $ 0.25
Net earnings per common share – diluted $ 0.54 $ 0.46 $ 0.24
Weighted average shares outstanding:
Basic 385,575 380,566 371,191
Diluted 397,526 394,349 385,999
See Notes to Consolidated Financial Statements.
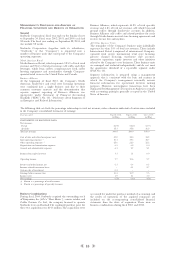
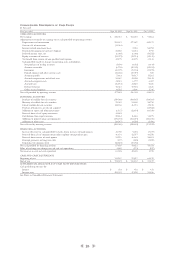
CONSOLIDATED BALANCE SHEETS
In thousands, except share data
Sept 29, 2002 Sept 30, 2001
ASSETS
Current assets:
Cash and cash equivalents $174,572 $ 113,237
Short-term investments – Available-for-sale securities 217,302 101,399
Short-term investments – Trading securities 10,360 5,913
Accounts receivable, net of allowances of $3,680 and $4,590, respectively 97,573 90,425
Inventories 263,174 221,253
Prepaid expenses and other current assets 42,351 29,829
Deferred income taxes, net 42,206 31,869
Total current assets 847,538 593,925
Equity and other investments 105,986 63,097
Property, plant and equipment, net 1,265,756 1,135,784
Other assets 53,554 31,868
Goodwill, net 19,902 21,845
TOTAL ASSETS $2,292,736 $ 1,846,519
LIABILITIES AND SHAREHOLDERS’ EQUITY
Current liabilities:
Accounts payable $135,994 $ 127,905
Checks drawn in excess of bank balances 74,895 61,987
Accrued compensation and related costs 105,899 81,458
Accrued occupancy costs 51,195 35,835
Accrued taxes 54,244 70,346
Other accrued expenses 72,289 40,117
Deferred revenue 42,264 26,919
Current portion of long-term debt 710 697
Total current liabilities 537,490 445,264
Deferred income taxes, net 22,496 19,133
Long-term debt 5,076 5,786
Other long-term liabilities 1,036 409
Shareholders’ equity:
Common stock and additional paid-in capital – Authorized, 600,000,000 shares;
issued and outstanding, 388,228,592 and 380,044,042 shares, respectively
(includes 1,697,100 common stock units in both years) 891,040 791,622
Other additional paid-in capital 39,393 -
Retained earnings 804,786 589,713
Accumulated other comprehensive loss (8,581) (5,408 )
Total shareholders’ equity 1,726,638 1,375,927
TOTAL LIABILITIES AND SHAREHOLDERS’ EQUITY $ 2,292,736 $ 1,846,519
See Notes to Consolidated Financial Statements.