Starbucks 2002 Annual Report Download - page 20
Download and view the complete annual report
Please find page 20 of the 2002 Starbucks annual report below. You can navigate through the pages in the report by either clicking on the pages listed below, or by using the keyword search tool below to find specific information within the annual report.-
 1
1 -
2
-
3
-
4
-
5
-
6
-
7
-
8
-
9
-
 10
10 -
 11
11 -
 12
12 -
 13
13 -
 14
14 -
 15
15 -
 16
16 -
 17
17 -
 18
18 -
 19
19 -
 20
20 -
 21
21 -
 22
22 -
 23
23 -
 24
24 -
 25
25 -
 26
26
 |
 |

34
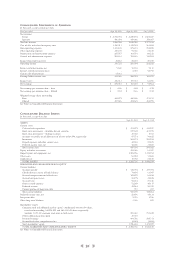
Note 14: Earnings Per Share
The following table represents the calculation of net earnings per common share – basic (in thousands, except earnings per share):
Fiscal year ended Sept 29, 2002 Sept 30, 2001 Oct 1, 2000
Net earnings $215,073 $ 181,210 $ 94,564
Weighted average common shares and common stock units outstanding 385,575 380,566 371,191
Net earnings per common share – basic $ 0.56 $ 0.48 $ 0.25
The following table represents the calculation of net earnings per common and common equivalent share – diluted (in thousands,
except earnings per share):
Fiscal year ended Sept 29, 2002 Sept 30, 2001 Oct 1, 2000
Net earnings $215,073 $ 181,210 $ 94,564
Weighted average common shares and common stock units outstanding 385,575 380,566 371,191
Dilutive effect of outstanding common stock options 11,951 13,783 14,808
Weighted average common and common equivalent shares outstanding 397,526 394,349 385,999
Net earnings per common and common equivalent share – diluted $ 0.54 $ 0.46 $ 0.24
Options with exercise prices greater than the average market price were not included in the computation of diluted earnings per
share.These options totaled 1.8 million, 0.9 million and 0.3 million in fiscal 2002, 2001 and 2000, respectively.
Note 15: Commitments and Contingencies
In connection with various yen denominated bank loans
entered into by Starbucks Coffee Japan, Ltd., the Company
guaranteed approximately $11.8 million of the outstanding
debt in the event of default by Starbucks Coffee Japan, Ltd.
On June 20, 2001, and July 2, 2001, two purported class action
lawsuits against the Company, entitled James Carr, et al. v.
Starbucks Corporation and Olivia Shields, et al. v. Starbucks
Corporation, were filed in the Superior Courts of California,
Alameda and Los Angeles Counties, respectively. On April 19,
2002, Starbucks announced that it had reached an agreement
to settle both lawsuits and fully resolve all claims brought by
the plaintiffs without engaging in protracted litigation.
Accordingly, Starbucks recorded an $18.0 million charge,
which is included in “General and administrative expenses” on
the accompanying consolidated financial statement of
earnings, for the estimated claims to eligible class members,
attorneys’ fees and costs, and costs to a third-party claims
administrator, as well as applicable employer payroll taxes. On
December 17, 2002, the settlement was approved. Claims
under the settlement agreement will be paid on a “claims
made” basis.The Company expects most claims will be paid in
the second quarter of fiscal 2003.
In addition to the California lawsuits described above, the
Company is party to various legal proceedings arising in the
ordinary course of its business, but it is not currently a party
to any legal proceeding that management believes would have
a material adverse effect on the consolidated financial position
or results of operations of the Company.
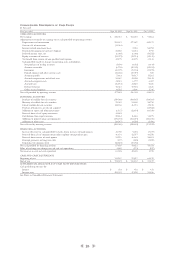
Note 16: Segment Reporting
The Company is organized into a number of business units,
which correspond to the Company’s operating segments.
North American Retail
North American Retail, which represents 92.5% of total retail
revenues and 78.6% of total net revenues, sells coffee and other
beverages, whole bean coffees, complementary food, coffee
brewing equipment and merchandise through Company-
operated retail stores in the United States and Canada.
Business Alliances
At the beginning of fiscal 2001, the Company’s North
American foodservice and retail store licensing operations
were combined into a single business unit due to their
common customer universe and the determination that
separate segment reporting of Business Alliances was
appropriate under SFAS No. 131,“Disclosures about Segments
of an Enterprise and Related Information.”
Business Alliances, which represents 44.8% of total specialty
revenues and 6.8% of total net revenues, sells whole bean and
ground coffees through foodservice accounts. In addition,
Business Alliances sells coffee and related products for resale
through North American retail store licensing agreements, and
receives license fees and royalties.
All Other Business Units
The remainder of the Company’s business units individually
represent less than 10% of total net revenues. These include
International Retail (comprised of international Company-
operated retail stores), international retail store licensing, grocery
channel licensing, warehouse club accounts, interactive
operations, equity investees and other initiatives related to the
Company’s core businesses. These business units are managed
and evaluated independently and do not meet the quantitative
thresholds of a reportable segment under SFAS No. 131.
Revenues from these segments include both sales to
unaffiliated customers and sales between segments, which are
accounted for on a basis consistent with sales to unaffiliated
customers. Segment information has been prepared using
amanagement approach that is consistent with the basis
and manner in which the Company’s management
internally reviews financial information for operational
decision making purposes. However, intersegment revenues,
consisting primarily of product sales to and from subsidiaries
and equity method investees, and other intersegment
transactions, which are included in the information presented
below, have been eliminated on the accompanying
consolidated financial statements.
The accounting policies of the operating segments are the
same as those described in the summary of significant
accounting policies in Note 1. Operating income represents
earnings before “Interest and other income, net,” “Internet-
related investment losses,” “Gain on sale of investment” and
“Income taxes.” No allocations of overhead, interest or income
taxes are made to the segments. Identifiable assets by segment
are those assets used in the Company’s operations in each
segment. General corporate assets include cash and
investments, unallocated assets of the corporate headquarters
and roasting facilities, deferred taxes and certain intangibles.
Management evaluates performance of the segments based on
direct product sales and operating costs.