Starbucks 2002 Annual Report Download - page 7
Download and view the complete annual report
Please find page 7 of the 2002 Starbucks annual report below. You can navigate through the pages in the report by either clicking on the pages listed below, or by using the keyword search tool below to find specific information within the annual report.-
 1
1 -
 2
2 -
 3
3 -
 4
4 -
 5
5 -
 6
6 -
 7
7 -
 8
8 -
 9
9 -
 10
10 -
 11
11 -
 12
12 -
 13
13 -
 14
14 -
 15
15 -
 16
16 -
 17
17 -
 18
18 -
19
-
20
-
21
-
22
-
23
-
24
-
25
-
26
 |
 |

21
RESULTS OF OPERATIONS—FISCAL 2001 COMPARED TO
FISCAL 2000
Systemwide Retail Store Sales
Systemwide retail store sales were $3.0 billion in fiscal 2001,
an increase of 31% from $2.3 billion in fiscal 2000, primarily
due to the opening of 1,208 stores.
Consolidated Net Revenues
During the fiscal year ended September 30, 2001, Starbucks
derived approximately 84% of net revenues from its
Company-operated retail stores. The remaining 16% of net
revenues was derived from the Company’s Specialty
Operations.Total net revenues in fiscal 2001 increased 22% to
$2.6 billion from $2.2 billion in fiscal 2000.
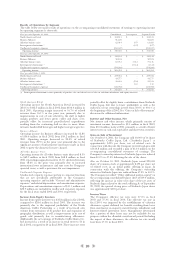
Net Revenues by Segment
North American Retail
North American Retail revenues increased by $351.4 million,
or 20%, to $2.1 billion in fiscal 2001, from $1.7 billion in fiscal
2000, primarily due to the addition of new Company-
operated retail stores and comparable store sales growth of
5%. The increase in comparable store sales resulted from a
2% increase in the number of transactions and a 3% increase
in the average dollar value per transaction.
Business Alliances
Business Alliances revenues increased by $32.8 million, or 20%,
to $193.6 million in fiscal 2001, from $160.8 million in fiscal
2000, primarily due to the opening of new licensed stores and
the resulting increase in royalty revenues from and product
sales to those licensees.
All Other Business Units (including International Retail, net of
Intersegment revenues)
Revenues for all other business units increased by $87.2
million, or 31%, to $369.1 million in fiscal 2001, from $281.9
million in fiscal 2000. This increase was mainly related to
growth in the number of international Company-operated
and licensed retail stores.
Consolidated Results of Operations
Cost of sales and related occupancy costs decreased to 42.0%
of net revenues in fiscal 2001, from 44.2% in the
corresponding period in fiscal 2000. The decrease resulted
from several factors, including lower green coffee costs, the
impact of retail beverage sales price increases, continued cost
savings from procurement initiatives and shifts in sales mix to
higher margin products.These factors were partially offset by
higher occupancy costs as a result of higher average rent
expense per square foot as well as the expansion of Company-
operated stores in international markets that have higher
occupancy costs as a percentage of revenues than North
American retail operations.
Store operating expenses as a percentage of retail revenues
increased to 39.3% in fiscal 2001, from 38.7% in fiscal 2000.
The increase was primarily due to higher payroll-related
expenditures resulting from higher average wage rates and the
continuing shift to more labor-intensive handcrafted
beverages, partially offset by leverage gained from regional
overhead expenses distributed over an expanded revenue base
and reductions in advertising expenses.
Other operating expenses were 22.3% of specialty revenues
in fiscal 2001, compared to 22.2% in fiscal 2000.The increase
was attributable to the Company’s licensee channels, both
international and domestic, as the Company expands these
businesses geographically and continues to develop its
internal resources for future growth. These costs were
partially offset by lower advertising expenses for the
Company’s interactive operations.
Depreciation and amortization expenses increased to $163.5
million in fiscal 2001, from $130.2 million in fiscal 2000.The
increase was mainly the result of opening new North
American and international retail stores.
General and administrative expenses increased to $151.4
million in fiscal 2001, compared to $110.2 million in fiscal
2000.The increase was primarily due to higher payroll-related
expenditures, professional fees, provisions for obsolete
software, charitable donations and uninsured expenses
resulting from the Nisqually earthquake in fiscal 2001.
Operating income increased 32.4% to $281.1 million in fiscal
2001, from $212.3 million in fiscal 2000.The operating margin
increased to 10.6% of total net revenues in fiscal 2001,
compared to 9.7% in the same period in fiscal 2000 primarily
due to growth of total net revenues and improvements in cost
of sales, as discussed above.
Results of Operations by Segment
North American Retail
Operating income for North American Retail increased by
34.6% to $336.4 million in fiscal 2001, from $249.9 million in
fiscal 2000. Operating margin increased to 16.1% of related
revenues from 14.4% in the prior year, primarily due to the
shift in sales to higher margin products and benefits from lower
green coffee costs.
Business Alliances
Operating income for Business Alliances increased by 14.6% to
$50.2 million in fiscal 2001, from $43.8 million in fiscal 2000.
Operating margin decreased to 25.9% of related revenues from
27.2% in the prior year, primarily due to increased operating
expenses resulting from the build-up of infrastructure to support
the expansion of the domestic licensee channel.
All Other Business Units
Operating income for all other business units increased by
28.7% to $68.8 million in fiscal 2001, from $53.4 million in
fiscal 2000. Operating margin decreased slightly to 18.6% of
related revenues from 19.0% in the prior year, primarily due
to higher International Retail payroll-related expenditures
partially offset by reductions in advertising expenses for the
Company’s interactive operations.
Unallocated Corporate Expenses
Unallocated corporate expenses pertain to corporate functions
that are not specifically attributable to the Company’s
operating segments and include “General and administrative
expenses” and certain depreciation and amortization expenses.
Depreciation and amortization expenses of $22.9 million and
$24.7 million are included in unallocated corporate expenses
for fiscal 2001 and 2000, respectively.
Income from Equity Investees
Income from equity investees was $28.6 million in fiscal 2001,
compared to $20.3 million in fiscal 2000. The increase was
primarily due to the improved profitability of the North
American Coffee Partnership that resulted from increased sales
volume from extensions of its product line and expansion of
geographic distribution, as well as improvements in its cost of
goods sold primarily due to manufacturing efficiencies. The
increase was also due to improved operating results of
Starbucks Coffee Japan, Ltd., attributable to additional
profitable store locations as well as the distribution of
infrastructure and administrative costs over an expanded
revenue base. Starbucks Coffee Japan, Ltd. had 289 stores open
as of September 30, 2001, compared to 154 stores open as of
October 1, 2000.
Internet-related Investment Losses
During fiscal 2001, the Company determined that its
investments in Internet-related companies had suffered
declines in value.The Company’s management deemed these
declines as other than temporary due to the sustained weak
conditions in the Internet industry as reflected in the
bankruptcy or liquidation proceedings of numerous
comparable companies and the significant decline in stock
market valuation of the sector, the declining financial
condition of each company in which the Company had
invested, the unfavorable prospects of such companies
obtaining additional funding and the length of time and extent
to which the quoted market values had been less than cost for
publicly traded companies. As a result, the Company
recognized losses totaling $2.9 million to write off the
Company’s remaining investment in Kozmo.com, which was
liquidated during fiscal 2001, and to reduce its investment in
Liveworld, Inc. (previously known as Talk City, Inc.).