Starbucks 2002 Annual Report Download - page 3
Download and view the complete annual report
Please find page 3 of the 2002 Starbucks annual report below. You can navigate through the pages in the report by either clicking on the pages listed below, or by using the keyword search tool below to find specific information within the annual report.-
 1
1 -
 2
2 -
 3
3 -
 4
4 -
 5
5 -
 6
6 -
 7
7 -
 8
8 -
 9
9 -
 10
10 -
 11
11 -
 12
12 -
 13
13 -
 14
14 -
15
-
16
-
17
-
18
-
19
-
20
-
21
-
22
-
23
-
24
-
25
-
26
 |
 |

17
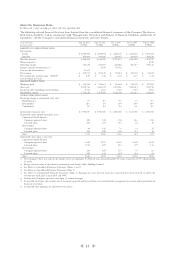
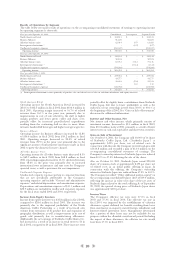
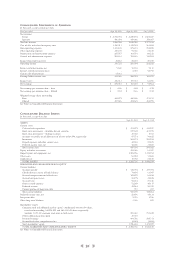
SELECTED FINANCIAL DATA
In thousands, except earnings per share and store operating data
The following selected financial data have been derived from the consolidated financial statements of the Company.The data set
forth below should be read in conjunction with “Management’s Discussion and Analysis of Financial Condition and Results of
Operations” and the Company’s consolidated financial statements and notes thereto.
As of and for the Sept 29, 2002 Sept 30, 2001 Oct 1, 2000 Oct 3, 1999 Sept 27, 1998
fiscal year ended (1) (52 Wks) (52 Wks) (52 Wks) (53 Wks) (52 Wks)
RESULTS OF OPERATIONS DATA
Net revenues:
Retail $ 2,792,904 $ 2,229,594 $ 1,823,607 $ 1,423,389 $ 1,102,574
Specialty 496,004 419,386 354,007 263,439 206,128
Total net revenues 3,288,908 2,648,980 2,177,614 1,686,828 1,308,702
Merger expenses (2) ----8,930
Operating income 318,725 281,094 212,252 156,711 109,216
Internet-related investment losses (3) -2,940 58,792 - -
Gain on sale of investment (4) 13,361 - - - -
Net earnings $ 215,073 $ 181,210 $ 94,564 $ 101,693 $ 68,372
Net earnings per common share – diluted (5) $0.54 $ 0.46 $ 0.24 $ 0.27 $ 0.19
Cash dividends per share - - - - -
BALANCE SHEET DATA
Working capital $ 310,048 $ 148,661 $ 146,568 $ 135,303 $ 157,805
Total assets 2,292,736 1,846,519 1,491,546 1,252,514 992,755
Long-term debt (including current portion) 5,786 6,483 7,168 7,691 1,803
Shareholders’ equity 1,726,638 1,375,927 1,148,399 961,013 794,297
STORE OPERATING DATA
Percentage change in comparable store sales (6)
North America 7% 5% 9% 6% 5%
International (3)% 2% 23% 20% 28%
Consolidated 6% 5% 9% 6% 5%
Systemwide retail store sales (7) $3,796,000 $ 2,950,000 $ 2,250,000 $ 1,633,000 $ 1,190,000
Systemwide stores opened during the year: (8)
Continental North America
Company-operated stores 525 525 408 416 352
Licensed stores 269 279 351 46 39
International
Company-operated stores 89 122 76 31 35
Licensed stores 294 282 168 119 48
Total 1,177 1,208 1,003 612 474
Systemwide stores open at year end:
Continental North America
Company-operated stores 3,496 2,971 2,446 2,038 1,622
Licensed stores 1,078 809 530 179 133
International
Company-operated stores 384 295 173 97 66
Licensed stores 928 634 352 184 65
Total 5,886 4,709 3,501 2,498 1,886
(1) The Company’s fiscal year ends on the Sunday closest to September 30. All fiscal years presented include 52 weeks, except fiscal 1999, which includes
53 weeks.
(2) Merger expenses relate to the business combination with Seattle Coffee Holdings Limited.
(3) See Notes to Consolidated Financial Statements (Notes 4 and 7).
(4) See Notes to Consolidated Financial Statements (Note 7).
(5) See Notes to Consolidated Financial Statements (Note 1). Earnings per share data for fiscal years presented have been restated to reflect the
two-for-one stock splits in fiscal 2001 and 1999.
(6) Includes only Company-operated stores open 13 months or longer.
(7) Systemwide retail store sales include sales at Company-operated and licensed stores and are believed by management to measure global penetration of
Starbucks retail stores.
(8) Systemwide store openings are reported net of closures.