Starbucks 2002 Annual Report Download - page 5
Download and view the complete annual report
Please find page 5 of the 2002 Starbucks annual report below. You can navigate through the pages in the report by either clicking on the pages listed below, or by using the keyword search tool below to find specific information within the annual report.-
 1
1 -
 2
2 -
 3
3 -
 4
4 -
 5
5 -
 6
6 -
 7
7 -
 8
8 -
 9
9 -
 10
10 -
 11
11 -
 12
12 -
 13
13 -
 14
14 -
 15
15 -
 16
16 -
17
-
18
-
19
-
20
-
21
-
22
-
23
-
24
-
25
-
26
 |
 |

19
RESULTS OF OPERATIONS—FISCAL 2002 COMPARED TO
FISCAL 2001
Systemwide Retail Store Sales
Systemwide retail store sales, which include net sales for both
Company-operated and licensed retail stores, were $3.8 billion
in fiscal 2002, an increase of 29% from $3.0 billion in fiscal
2001, primarily due to the opening of 1,177 new stores and
strong comparable store sales growth in North America.
During fiscal 2003, Starbucks expects to open at least 1,200
new stores, including approximately 525 Company-operated
and 225 licensed stores in North America, and 75 Company-
operated and 375 licensed stores internationally.
Consolidated Net Revenues
During the fiscal year ended September 29, 2002, Starbucks
derived approximately 85% of net revenues from its
Company-operated retail stores. Retail revenues include the
North American Retail and International Retail business
units. The remaining 15% of net revenues was derived from
the Company’s Specialty Operations, which includes Business
Alliances and all other non-retail business units.
Net revenues increased 24% from $2.6 billion in fiscal 2001 to
$3.3 billion in fiscal 2002, primarily due to the Company’s
store expansion program and comparable store sales increases.
Comparable store sales increased by 6%, 5%, and 9% in fiscal
2002, 2001 and 2000, respectively. As a result of its expansion
strategy of clustering stores in existing markets, Starbucks has
experienced a certain level of cannibalization of sales of
existing stores by new stores as store concentration has
increased.However, management believes such cannibalization
has been justified by the incremental sales and return on new
store investments. This cannibalization, as well as increased
competition, slowing economies and other factors, may put
downward pressure on the Company’s comparable store sales
growth in future periods.
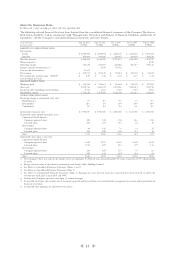
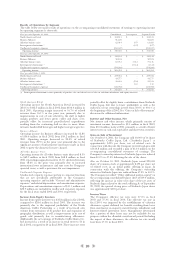
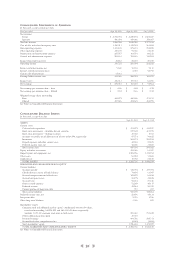
The table below reconciles revenues by operating segment to
revenues on the accompanying consolidated statements of
earnings (in thousands):
Fiscal year ended Sept 29, Sept 30, Oct 1,
2002 2002 2000
North American Retail $ 2,583,756 $ 2,086,354 $1,734,929
International Retail 209,148 143,240 88,678
Subtotal – Retail revenues 2,792,904 2,229,594 1,823,607
Business Alliances 222,410 193,574 160,812
All other business units
(excl. International Retail) 344,425 276,603 216,402
Intersegment revenues (1) (70,831) (50,791) (23,207)
Subtotal – Specialty revenues 496,004 419,386 354,007
Total net revenues $ 3,288,908 $ 2,648,980 $2,177,614
(1) Intersegment revenues consist primarily of product sales to and from
subsidiaries and equity method investees.
Net Revenues by Segment
North American Retail
North American Retail revenues increased by $497.4 million,
or 24%, to $2.6 billion in fiscal 2002, from $2.1 billion in fiscal
2001, primarily due to the opening of 525 new retail stores in
fiscal 2002 and comparable store sales growth of 7% for the
period. The increase in comparable store sales was due to
higher transaction volume. Management believes increased
customer traffic was driven by new product innovation, which
continues to broaden the customer base during non-peak
hours of operation, and by expanding the Company’s capacity
to satisfy customer demand through enhanced technology,
training and execution at retail stores.
Business Alliances
Business Alliances revenues increased by $28.8 million, or 15%,
to $222.4 million in fiscal 2002, from $193.6 million in fiscal
2001, primarily due to the opening of 269 new licensed stores
in fiscal 2002 and the resulting increase in royalty revenues
from and product sales to those licensees.
All Other Business Units (including International Retail, net of
Intersegment revenues)
Revenues for all other business units increased by $113.6
million, or 31%, to $482.7 million for fiscal 2002, from $369.1
million in fiscal 2001. This increase was mainly related to
growth in the number of international Company-operated
and licensed retail stores.
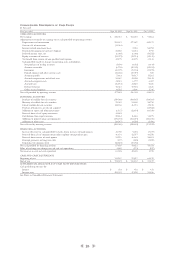
Consolidated Results of Operations
Cost of sales and related occupancy costs decreased to 41.0%
of net revenues in fiscal 2002, from 42.0% in fiscal 2001.The
decrease was primarily due to a shift in sales mix to higher
margin products, such as handcrafted beverages, as well as
lower green coffee costs. Starbucks does not expect a benefit
from lower green coffee costs in fiscal 2003, as the Company
has moved away from formula-based commodity exchange
pricing contracts, and is instead basing most contracts on
higher, fixed prices to encourage the continuing supply of
high-quality green coffee. Improvements in cost of sales were
partially offset by higher occupancy costs due to increased
repair and maintenance activities on Company-operated retail
stores and the continuing trend of higher retail rent expense.
Store operating expenses as a percentage of retail revenues
increased to 40.1% in fiscal 2002, from 39.3% in fiscal 2001.
The restaurant portion of retail revenues, which is comprised
of made-to-order beverages and fresh food, was a higher
proportion of total retail revenues in fiscal 2002.This resulted
in higher payroll-related expenditures due to the continuing
shift in sales to more labor-intensive handcrafted beverages as
well as higher average wage rates. Higher provisions for retail
store asset impairment and disposals of $26.0 million in fiscal
2002 compared to $7.3 million in fiscal 2001 also contributed
to the unfavorable variance.
Starbucks regularly monitors the financial results of its
Company-operated retail stores and accumulates historical
operating measures to identify performance trends in various
markets. Provisions for asset impairment are recorded when,
among other things, retail stores are unable to generate current
and future estimated undiscounted cash flows in excess of asset
carrying values. Gains and losses on disposals are generated
primarily through renovation activities.
Other operating expenses (expenses associated with non-
retail operations) were 25.6% of specialty revenues in fiscal
2002, compared to 22.3% in fiscal 2001. The increase was a
result of continued development of the Company’s
international infrastructure, including additional regional
offices and employees supporting global expansion, as well as
higher advertising expenditures from the Company’s
interactive operations.
Depreciation and amortization expenses increased to $205.6
million in fiscal 2002, from $163.5 million in fiscal 2001.The
increase was primarily due to the opening of 525 new North
American and 89 new international Company-operated
retail stores.
General and administrative expenses increased to $202.2
million in fiscal 2002, compared to $151.4 million in fiscal
2001.The increase was primarily due to higher payroll-related
expenditures and an $18.0 million litigation settlement charge
related to two class action lawsuits.
Operating income increased 13.4% to $318.7 million in fiscal
2002, from $281.1 million in fiscal 2001.The operating margin
decreased to 9.7% of total net revenues in fiscal 2002,
compared to 10.6% in fiscal 2001 primarily due to higher
operating expenses partially offset by cost of sales
improvements, as discussed above.