Starbucks 2002 Annual Report Download - page 11
Download and view the complete annual report
Please find page 11 of the 2002 Starbucks annual report below. You can navigate through the pages in the report by either clicking on the pages listed below, or by using the keyword search tool below to find specific information within the annual report.-
 1
1 -
 2
2 -
 3
3 -
 4
4 -
 5
5 -
 6
6 -
 7
7 -
 8
8 -
 9
9 -
 10
10 -
 11
11 -
 12
12 -
 13
13 -
 14
14 -
 15
15 -
 16
16 -
 17
17 -
 18
18 -
 19
19 -
 20
20 -
 21
21 -
 22
22 -
23
-
24
-
25
-
26
 |
 |

25
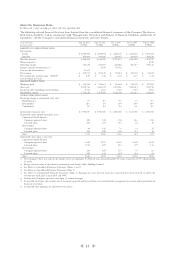
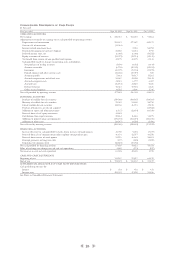
CONSOLIDATED STATEMENTS OF CASH FLOWS
In thousands
Fiscal year ended Sept 29, 2002 Sept 30, 2001 Oct 1, 2000
OPERATING ACTIVITIES:
Net earnings $215,073 $ 181,210 $ 94,564
Adjustments to reconcile net earnings to net cash provided by operating activities:
Depreciation and amortization 221,141 177,087 142,171
Gain on sale of investment (13,361) - -
Internet-related investment losses - 2,940 58,792
Provision for impairment and asset disposals 26,852 11,044 5,753
Deferred income taxes, net (6,088) (6,068) (18,252 )
Equity in income of investees (21,972) (15,713) (15,139)
Tax benefit from exercise of non-qualified stock options 44,199 30,899 31,131
Cash provided/(used) by changes in operating assets and liabilities:
Net purchases of trading securities (5,699) (4,032) (1,414 )
Accounts receivable (6,703) (20,399) (25,013)
Inventories (41,379) (19,704) (19,495)
Prepaid expenses and other current assets (12,460) (10,919) 885
Accounts payable 5,463 54,117 15,561
Accrued compensation and related costs 24,087 12,098 25,415
Accrued occupancy costs 15,343 6,797 6,007
Accrued taxes (16,154) 34,548 5,026
Deferred revenue 15,321 19,594 6,836
Other accrued expenses 34,022 2,806 5,746
Net cash provided by operating activities 477,685 456,305 318,574
INVESTING ACTIVITIES:
Purchase of available-for-sale securities (339,968) (184,187) (118,501)
Maturity of available-for-sale securities 78,349 93,500 58,750
Sale of available-for-sale securities 144,760 46,931 49,238
Purchase of businesses, net of cash acquired - - (13,522)
Additions to equity and other investments (6,137) (12,874) (43,930)
Proceeds from sale of equity investment 14,843 - -
Distributions from equity investees 22,834 16,863 14,279
Additions to property, plant and equipment (375,474) (384,215) (316,450 )
Additions to other assets (24,547) (4,550) (3,096 )
Net cash used by investing activities (485,340) (428,532) (373,232)
FINANCING ACTIVITIES:
Increase/(decrease) in cash provided by checks drawn in excess of bank balances 12,908 5,655 (7,479 )
Proceeds from sale of common stock under employee stock purchase plan 16,191 12,977 10,258
Proceeds from exercise of stock options 91,276 46,662 58,463
Principal payments on long-term debt (697) (685) (1,889 )
Repurchase of common stock (52,248) (49,788) -
Net cash provided by financing activities 67,430 14,821 59,353
Effect of exchange rate changes on cash and cash equivalents 1,560 (174) (297 )
Net increase in cash and cash equivalents 61,335 42,420 4,398
CASH AND CASH EQUIVALENTS:
Beginning of year 113,237 70,817 66,419
End of year $174,572 $ 113,237 $ 70,817
SUPPLEMENTAL DISCLOSURE OF CASH FLOW INFORMATION:
Cash paid during the year for:
Interest $303 $ 432 $ 411
Income taxes 105,339 47,690 51,856
See Notes to Consolidated Financial Statements.