Starbucks 2002 Annual Report Download - page 21
Download and view the complete annual report
Please find page 21 of the 2002 Starbucks annual report below. You can navigate through the pages in the report by either clicking on the pages listed below, or by using the keyword search tool below to find specific information within the annual report.-
 1
1 -
2
-
3
-
4
-
5
-
6
-
7
-
8
-
9
-
10
-
 11
11 -
 12
12 -
 13
13 -
 14
14 -
 15
15 -
 16
16 -
 17
17 -
 18
18 -
 19
19 -
 20
20 -
 21
21 -
 22
22 -
 23
23 -
 24
24 -
 25
25 -
 26
26
 |
 |

35
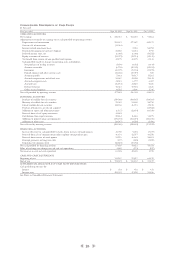
The table below presents information by operating segment (in thousands):
Intersegment
North All other eliminations/
American Business business Unallocated
Fiscal year ended Retail Alliances units corporate Total
Fiscal 2002:
Total net revenues $ 2,583,756 $ 222,410 $ 553,573 $ (70,831) $ 3,288,908
Earnings before income taxes (1) (2) 432,513 56,605 63,021 (210,753) 341,386
Depreciation and amortization expenses 143,337 6,153 27,331 28,736 205,557
Income from equity investees - - 22,014 13,818 35,832
Identifiable assets 897,651 51,662 357,997 985,426 2,292,736
Fiscal 2001:
Total net revenues $ 2,086,354 $ 193,574 $ 419,843 $ (50,791) $ 2,648,980
Earnings before income taxes (1) (2) 336,434 50,165 70,116 (167,793) 288,922
Depreciation and amortization expenses 115,061 5,278 17,768 25,394 163,501
Income from equity investees - - 17,556 11,059 28,615
Identifiable assets 873,306 57,578 217,027 698,608 1,846,519
Fiscal 2000:
Total net revenues $ 1,734,929 $ 160,812 $ 305,080 $ (23,207) $ 2,177,614
Earnings before income taxes (1) (2) 249,924 43,777 53,323 (186,454) 160,570
Depreciation and amortization expenses 94,312 3,547 10,117 22,256 130,232
Income from equity investees - - 15,139 5,161 20,300
Identifiable assets 664,773 52,596 111,521 659,434 1,488,324
(1) North American Retail and International Retail regularly monitor the financial results of their Company-operated retail stores and accumulate
historical operating measures to identify performance trends in various markets. Provisions for long-lived asset impairment are recorded when, among
other things, retail stores are unable to generate current and future estimated undiscounted cash flows in excess of asset carrying values, consisting
primarily of leasehold improvements. Gains and losses on disposals are generated primarily through renovation activities. As a result of these activities,
Starbucks recorded provisions and net losses of $26.0 million, $7.3 million and $4.4 million in fiscal 2002, 2001 and 2000, respectively.
(2) Unallocated corporate includes general and administrative expenses, certain depreciation expenses on general and administrative related assets, as well
as amounts included in “Interest and other income, net,”“Internet-related investment losses,” and “Gain on sale of investment” on the accompanying
consolidated statements of earnings.
The tables below represent information by geographic area (in thousands):
Fiscal year ended Sept 29, 2002 Sept 30, 2001 Oct 1, 2000
Net revenues from external customers:
United States $2,830,650 $ 2,301,013 $ 1,910,092
Foreign countries 458,258 347,967 267,522
Total $3,288,908 $ 2,648,980 $ 2,177,614
Revenues from foreign countries are based on the location of the customers and consist primarily of retail revenues from Canada
and the United Kingdom as well as specialty revenues generated from product sales to international licensees. No customer
accounts for 10% or more of the Company’s revenues.
Fiscal year ended Sept 29, 2002 Sept 30, 2001 Oct 1, 2000
Long-lived assets:
United States $1,206,101 $ 1,065,448 $ 915,762
Foreign countries 239,097 187,146 114,328
Total $ 1,445,198 $ 1,252,594 $ 1,030,090
Assets attributed to foreign countries are based on the country in which those assets are located.
Note 17: Quarterly Financial Information (Unaudited)
Summarized quarterly financial information in fiscal years 2002 and 2001 is as follows (in thousands, except earnings per share):
First Second Third Fourth
2002 quarter:
Net revenues $ 805,335 $ 783,217 $ 835,158 $ 865,198
Operating income 92,646 48,780 87,709 89,590
Net earnings 68,355 32,077 56,174 58,467
Net earnings per common share – diluted $ 0.17 $ 0.08 $ 0.14 $ 0.15
2001 quarter:
Net revenues $ 667,387 $ 629,288 $ 662,769 $ 689,536
Operating income 76,057 50,854 71,307 82,876
Net earnings 48,995 32,210 46,757 53,248
Net earnings per common share – diluted $ 0.12 $ 0.08 $ 0.12 $ 0.14