Starbucks 2002 Annual Report Download - page 4
Download and view the complete annual report
Please find page 4 of the 2002 Starbucks annual report below. You can navigate through the pages in the report by either clicking on the pages listed below, or by using the keyword search tool below to find specific information within the annual report.-
 1
1 -
 2
2 -
 3
3 -
 4
4 -
 5
5 -
 6
6 -
 7
7 -
 8
8 -
 9
9 -
 10
10 -
 11
11 -
 12
12 -
 13
13 -
 14
14 -
 15
15 -
16
-
17
-
18
-
19
-
20
-
21
-
22
-
23
-
24
-
25
-
26
 |
 |

18
MANAGEMENT’SDISCUSSION AND ANALYSIS OF
FINANCIAL CONDITION AND RESULTS OF OPERATIONS
General
Starbucks Corporation’s fiscal year ends on the Sunday closest
to September 30. Fiscal years 2002, 2001 and 2000 each had
52 weeks.The fiscal year ending on September 28, 2003, will
also include 52 weeks.
Starbucks Corporation (together with its subsidiaries,
“Starbucks” or the “Company”) is organized into a
number of business units that correspond to the Company’s
operating segments:
North American Retail
North American Retail, which represents 92.5% of total retail
revenues and 78.6% of total net revenues, sells coffee and other
beverages, whole bean coffees, complementary food, coffee
brewing equipment and merchandise through Company-
operated retail stores in the United States and Canada.
Business Alliances
At the beginning of fiscal 2001, the Company’s North
American foodservice and retail store licensing operations
were combined into a single business unit due to their
common customer universe and the determination that
separate segment reporting of Business Alliances was
appropriate under Statement of Financial Accounting
Standards (“SFAS”) No. 131, “Disclosures about Segments of
an Enterprise and Related Information.”
Business Alliances, which represents 44.8% of total specialty
revenues and 6.8% of total net revenues, sells whole bean and
ground coffees through foodservice accounts. In addition,
Business Alliances sells coffee and related products for resale
through North American retail store licensing agreements and
receives license fees and royalties.
All Other Business Units
The remainder of the Company’s business units individually
represent less than 10% of total net revenues. These include
International Retail (comprised of international Company-
operated retail stores), international retail store licensing,
grocery channel licensing, warehouse club accounts,
interactive operations, equity investees and other initiatives
related to the Company’s core businesses.These business units
are managed and evaluated independently and do not meet
the quantitative threshold of a reportable segment under
SFAS No. 131.
Segment information is prepared using a management
approach that is consistent with the basis and manner in
which the Company’s management internally reviews
financial information for operational decision making
purposes. However, intersegment transactions have been
eliminated for Management’s Discussion & Analysis to comply
with accounting principles generally accepted in the United
States of America.
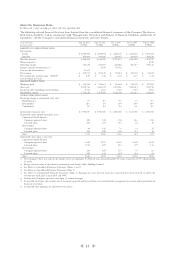
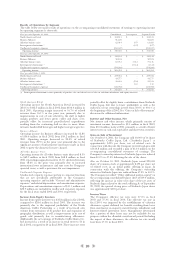
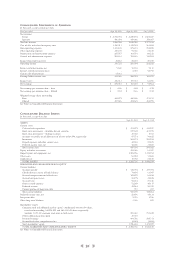
The following table sets forth the percentage relationship to total net revenues, unless otherwise indicated, of certain items included
in the Company’s consolidated statements of earnings:
Fiscal year ended Sept 29, 2002 Sept 30, 2001 Oct 1, 2000
(52 Wks) (52 Wks) (52 Wks)
STATEMENTS OF EARNINGS DATA
Net revenues:
Retail 84.9% 84.2% 83.7%
Specialty 15.1 15.8 16.3
Total net revenues 100.0 100.0 100.0
Cost of sales and related occupancy costs 41.0 42.0 44.2
Store operating expenses (1) 40.1 39.3 38.7
Other operating expenses (2) 25.6 22.3 22.2
Depreciation and amortization expenses 6.3 6.2 6.0
General and administrative expenses 6.1 5.7 5.1
Income from equity investees 1.1 1.1 0.9
Operating income 9.7 10.6 9.7
Interest and other income, net 0.3 0.4 0.3
Internet-related investment losses - 0.1 2.7
Gain on sale of investment 0.4 - -
Earnings before income taxes 10.4 10.9 7.3
Income taxes 3.9 4.1 3.0
Net earnings 6.5% 6.8% 4.3%
(1) Shown as a percentage of retail revenues.
(2) Shown as a percentage of specialty revenues.
Business Combinations
During fiscal 2000, Starbucks acquired the outstanding stock
of Tympanum, Inc. (d/b/a “Hear Music”), a music retailer, and
Coffee Partners Co. Ltd., the company licensed to operate
Starbucks stores in Thailand.The combined purchase price for
these two acquisitions was $14.1 million.The acquisitions were
accounted for under the purchase method of accounting, and
the results of operations of the acquired companies are
included on the accompanying consolidated financial
statements from the dates of acquisition. There were no
business combinations during fiscal 2001 and 2002.