Starbucks 2003 Annual Report Download - page 13

Download and view the complete annual report

Please find page 13 of the 2003 Starbucks annual report below. You can navigate through the pages in the report by either clicking on the pages listed below, or by using the keyword search tool below to find specific information within the annual report.

Page out of 28

  • 1
  • 2
  • 3
  • 4
  • 5
  • 6
  • 7
  • 8
  • 9
  • 10
  • 11
  • 12
  • 13
  • 14
  • 15
  • 16
  • 17
  • 18
  • 19
  • 20
  • 21
  • 22
  • 23
  • 24
  • 25
  • 26
  • 27
  • 28

24฀ Fiscal฀2003฀Annual฀Report
Fiscal฀2003฀Annual฀Report฀ 25
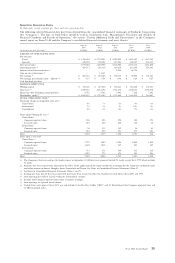
CONSOLIDATEDSTATEMENTSOFCASHFLOWS
Inthousands
Fiscal฀year฀ended ฀฀฀฀฀฀฀฀฀฀฀฀฀฀฀฀฀฀฀฀฀฀฀฀฀฀฀฀฀฀฀฀฀฀฀฀฀฀฀฀฀฀฀฀฀฀฀฀฀฀฀฀฀฀฀฀฀฀฀฀฀฀฀฀฀฀฀฀฀฀฀฀฀฀฀฀฀฀฀฀฀฀฀฀฀฀฀฀฀฀฀฀฀฀฀฀฀฀฀฀฀฀฀฀฀฀฀฀฀฀฀฀฀฀฀฀฀฀฀฀฀฀฀฀฀฀ Sept฀28,2003฀฀฀฀฀฀ Sept฀29,2002฀฀฀฀฀฀฀฀ Sept฀30,2001
OPERATING฀ACTIVITIES:฀฀฀฀฀฀฀฀฀฀฀฀฀฀฀฀฀฀฀฀฀฀฀฀฀฀฀฀฀฀฀฀฀฀฀฀฀฀฀฀฀฀฀฀฀฀฀฀฀฀฀฀฀฀฀฀฀฀฀฀฀฀฀฀฀฀฀฀฀฀฀฀฀฀฀฀฀฀฀฀฀฀฀฀฀฀฀฀฀฀฀฀฀฀฀฀฀฀฀฀฀฀฀฀฀ ฀฀฀฀฀฀฀฀฀฀฀฀฀฀ ฀฀฀฀฀฀฀฀ ฀฀฀฀฀฀฀฀฀฀฀฀฀฀ ฀฀฀฀฀฀฀฀฀
Net฀earning ฀฀฀฀฀฀฀฀฀฀฀฀฀฀฀฀฀฀฀฀฀฀฀฀฀฀฀฀฀฀฀฀฀฀฀฀฀฀฀฀฀฀฀฀฀฀฀฀฀฀฀฀฀฀฀฀฀฀฀฀฀฀฀฀฀฀฀฀฀฀฀฀฀฀฀฀฀฀฀฀฀฀฀฀฀฀฀฀฀฀฀฀฀฀฀฀฀฀฀฀฀฀฀฀฀฀฀฀฀฀฀฀฀฀฀฀฀฀฀฀฀฀฀฀฀฀฀฀ $ ฀฀฀฀ 268,346฀฀฀฀฀฀ ฀$ ฀฀฀฀212,686฀฀฀฀฀฀฀ $ ฀฀฀฀ 180,335
Adjustments฀to฀reconcile฀net฀earnings฀to฀net฀cash฀provided฀by฀operating฀activities: ฀฀฀฀฀฀฀฀฀฀฀฀฀฀฀฀฀฀฀฀฀฀฀฀฀฀฀฀฀ ฀฀฀฀฀฀฀฀฀฀฀฀฀฀ ฀฀฀฀฀฀฀฀
Depreciation฀and฀amortization ฀฀฀฀฀฀฀฀฀฀฀฀฀฀฀฀฀฀฀฀฀฀฀฀฀฀฀฀฀฀฀฀฀฀฀฀฀฀฀฀฀฀฀฀฀฀฀฀฀฀฀฀฀฀฀฀฀฀฀฀฀฀฀฀฀฀฀฀฀฀฀฀฀฀฀฀฀฀฀฀฀฀฀฀฀฀฀฀฀฀฀฀฀฀฀฀฀฀฀ ฀฀฀฀259,271฀฀฀฀฀฀฀฀ ฀฀฀฀221,141฀฀฀฀฀฀฀฀฀฀฀฀฀฀ 177,087
Gain฀on฀sale฀of฀investment฀฀฀฀฀฀฀฀฀฀฀฀฀฀฀฀฀฀฀฀฀฀฀฀฀฀฀฀฀฀฀฀฀฀฀฀฀฀฀฀฀฀฀฀฀฀฀฀฀฀฀฀฀฀฀฀฀฀฀฀฀฀฀฀฀฀฀฀฀฀฀฀฀฀฀฀฀฀฀฀฀฀฀฀฀฀฀฀฀฀฀฀฀฀฀฀฀฀฀฀฀฀฀฀฀฀ ฀฀฀฀฀฀฀฀฀฀–฀ ฀ ฀฀฀฀฀฀฀฀฀ ฀฀฀ (13,361)฀฀฀฀฀฀฀฀฀฀฀฀฀฀฀฀฀฀฀฀ –฀ ฀
Internet-related฀investment฀losses ฀฀฀฀฀฀฀฀฀฀฀฀฀฀฀฀฀฀฀฀฀฀฀฀฀฀฀฀฀฀฀฀฀฀฀฀฀฀฀฀฀฀฀฀฀฀฀฀฀฀฀฀฀฀฀฀฀฀฀฀฀฀฀฀฀฀฀฀฀฀฀฀฀฀฀฀฀฀฀฀฀฀฀฀฀฀฀฀฀฀฀฀฀฀฀฀฀฀฀฀฀฀฀฀฀฀฀ –฀ ฀ ฀฀฀฀฀฀฀฀฀฀฀฀฀฀฀฀฀฀฀฀–฀ ฀ ฀฀฀฀฀฀฀฀฀฀฀฀฀฀฀฀฀ 2,940
Provision฀for฀impairments฀and฀asset฀disposals ฀฀฀฀฀฀฀฀฀฀฀฀฀฀฀฀฀฀฀฀฀฀฀฀฀฀฀฀฀฀฀฀฀฀฀฀฀฀฀฀฀฀฀฀฀฀฀฀฀฀฀฀฀฀฀฀฀฀฀฀฀฀฀฀฀฀฀฀฀฀฀฀฀฀฀฀฀฀฀ ฀฀฀฀฀฀฀ 7,784฀฀฀฀฀฀฀฀ ฀฀฀฀฀฀26,852฀฀฀฀฀฀฀฀฀฀฀฀฀฀฀฀11,044
Deferred฀income฀taxes,net ฀฀฀฀฀฀฀฀฀฀฀฀฀฀฀฀฀฀฀฀฀฀฀฀฀฀฀฀฀฀฀฀฀฀฀฀฀฀฀฀฀฀฀฀฀฀฀฀฀฀฀฀฀฀฀฀฀฀฀฀฀฀฀฀฀฀฀฀฀฀฀฀฀฀฀฀฀฀฀฀฀฀฀฀฀฀฀฀฀฀฀฀฀฀฀฀฀฀฀฀฀฀฀฀ ฀฀฀฀฀ (5,932)฀฀฀฀฀฀฀฀฀฀฀฀฀฀฀ (6,088)฀฀฀฀฀฀฀฀฀฀฀฀฀฀฀ (6,068)
Equity฀in฀income฀of฀investees฀฀฀฀฀฀฀฀฀฀฀฀฀฀฀฀฀฀฀฀฀฀฀฀฀฀฀฀฀฀฀฀฀฀฀฀฀฀฀฀฀฀฀฀฀฀฀฀฀฀฀฀฀฀฀฀฀฀฀฀฀฀฀฀฀฀฀฀฀฀฀฀฀฀฀฀฀฀฀฀฀฀฀฀฀฀฀฀฀฀฀฀฀฀฀฀฀฀฀฀฀฀ ฀฀฀ (22,813)฀฀฀฀฀฀฀฀฀฀฀฀฀ (19,584)฀฀฀฀฀฀฀฀฀฀฀฀฀ (14,838)
Tax฀benefit฀from฀exercise฀of฀non-qualified฀stock฀options ฀฀฀฀฀฀฀฀฀฀฀฀฀฀฀฀฀฀฀฀฀฀฀฀฀฀฀฀฀฀฀฀฀฀฀฀฀฀฀฀฀฀฀฀฀฀฀฀฀฀฀฀฀฀฀฀฀฀฀฀฀฀฀฀ ฀฀฀฀฀฀36,590฀฀฀฀฀฀฀฀ ฀฀฀฀฀฀44,199฀฀฀฀฀฀฀฀฀฀฀฀฀฀฀฀30,899
Net฀accretion฀of฀discount฀and฀amortization฀of฀premium฀on฀marketable฀securities ฀฀฀฀฀฀฀฀฀฀฀฀฀฀฀฀฀฀฀฀฀฀฀฀฀฀฀฀ ฀฀฀฀฀฀฀ 5,996฀฀฀฀฀฀฀฀฀ ฀฀฀฀฀฀฀฀฀–฀ ฀ ฀฀฀฀฀฀฀฀฀฀฀฀฀฀฀฀฀฀฀฀฀ –฀ ฀
฀ Cash฀provided/(used)฀by฀changes฀in฀operating฀assets฀and฀liabilities:
฀ ฀ Inventories ฀฀฀฀฀฀฀฀฀฀฀฀฀฀฀฀฀฀฀฀฀฀฀฀฀฀฀฀฀฀฀฀฀฀฀฀฀฀฀฀฀฀฀฀฀฀฀฀฀฀฀฀฀฀฀฀฀฀฀฀฀฀฀฀฀฀฀฀฀฀฀฀฀฀฀฀฀฀฀฀฀฀฀฀฀฀฀฀฀฀฀฀฀฀฀฀฀฀฀฀฀฀฀฀฀฀฀฀฀฀฀฀฀฀฀฀฀฀฀฀฀฀฀ ฀฀฀฀฀(64,768฀)฀฀฀฀฀฀฀ ฀฀฀฀ (41,379฀)฀฀฀฀฀฀฀฀฀฀฀฀฀฀(19,704฀)
฀ ฀ Prepaid฀expenses฀and฀other฀current฀assets ฀฀฀฀฀฀฀฀฀฀฀฀฀฀฀฀฀฀฀฀฀฀฀฀฀฀฀฀฀฀฀฀฀฀฀฀฀฀฀฀฀฀฀฀฀฀฀฀฀฀฀฀฀฀฀฀฀฀฀฀฀฀฀฀฀฀฀฀฀฀฀฀฀฀฀฀฀฀฀฀฀฀฀฀฀฀฀(12,861฀)฀฀฀฀฀฀฀฀฀฀฀฀฀ (12,460฀)฀฀฀฀฀฀฀฀฀฀฀฀฀฀(10,919฀)
Accounts฀payable ฀฀฀฀฀฀฀฀฀฀฀฀฀฀฀฀฀฀฀฀฀฀฀฀฀฀฀฀฀฀฀฀฀฀฀฀฀฀฀฀฀฀฀฀฀฀฀฀฀฀฀฀฀฀฀฀฀฀฀฀฀฀฀฀฀฀฀฀฀฀฀฀฀฀฀฀฀฀฀฀฀฀฀฀฀฀฀฀฀฀฀฀฀฀฀฀฀฀฀฀฀฀฀฀฀฀฀฀฀฀฀฀฀฀฀ ฀ ฀฀฀฀฀฀24,990฀฀฀฀฀฀฀฀฀฀฀฀฀฀฀฀฀ 5,463฀฀฀฀฀฀฀฀฀฀฀฀฀฀฀฀54,117
Accrued฀compensation฀and฀related฀costs ฀฀฀฀฀฀฀฀฀฀฀฀฀฀฀฀฀฀฀฀฀฀฀฀฀฀฀฀฀฀฀฀฀฀฀฀฀฀฀฀฀฀฀฀฀฀฀฀฀฀฀฀฀฀฀฀฀฀฀฀฀฀฀฀฀฀฀฀฀฀฀฀฀฀฀฀฀฀฀฀฀฀฀฀฀฀฀฀฀฀42,132฀฀฀฀฀฀฀฀฀฀฀฀฀฀฀฀24,087฀฀฀฀฀฀฀฀฀฀฀฀฀฀฀฀12,098
Accrued฀occupancy฀costs฀฀฀฀฀฀฀฀฀฀฀฀฀฀฀฀฀฀฀฀฀฀฀฀฀฀฀฀฀฀฀฀฀฀฀฀฀฀฀฀฀฀฀฀฀฀฀฀฀฀฀฀฀฀฀฀฀฀฀฀฀฀฀฀฀฀฀฀฀฀฀฀฀฀฀฀฀฀฀฀฀฀฀฀฀฀฀฀฀฀฀฀฀฀฀฀฀฀฀฀฀฀฀฀฀ ฀฀฀฀฀฀฀ 4,293฀฀฀฀฀฀฀฀฀ ฀฀฀฀฀฀15,343฀฀฀฀฀฀฀฀฀฀฀฀฀฀฀฀฀ 6,797
฀ ฀ Deferred฀revenue ฀฀฀฀฀฀฀฀฀฀฀฀฀฀฀฀฀฀฀฀฀฀฀฀฀฀฀฀฀฀฀฀฀฀฀฀฀฀฀฀฀฀฀฀฀฀฀฀฀฀฀฀฀฀฀฀฀฀฀฀฀฀฀฀฀฀฀฀฀฀฀฀฀฀฀฀฀฀฀฀฀฀฀฀฀฀฀฀฀฀฀฀฀฀฀฀฀฀฀฀฀฀฀฀฀฀฀฀฀฀฀฀฀฀ ฀฀฀฀฀฀30,732฀฀฀฀฀฀฀฀ ฀฀฀฀฀฀15,321฀฀฀฀฀฀฀฀฀฀฀฀฀฀฀฀19,594
฀ ฀ Other฀operating฀assets฀and฀liabilities ฀฀฀฀฀฀฀฀฀฀฀฀฀฀฀฀฀฀฀฀฀฀฀฀฀฀฀฀฀฀฀฀฀฀฀฀฀฀฀฀฀฀฀฀฀฀฀฀฀฀฀฀฀฀฀฀฀฀฀฀฀฀฀฀฀฀฀฀฀฀฀฀฀฀฀฀฀฀฀฀฀฀฀฀฀฀฀฀ ฀฀฀฀฀฀ (7,313฀)฀฀฀฀฀฀฀฀฀฀฀฀฀฀฀ ฀5,465฀฀฀฀฀฀฀฀฀฀฀฀฀฀฀฀12,923
Net฀cash฀provided฀by฀operating฀activities ฀฀฀฀฀฀฀฀฀฀฀฀฀฀฀฀฀฀฀฀฀฀฀฀฀฀฀฀฀฀฀฀฀฀฀฀฀฀฀฀฀฀฀฀฀฀฀฀฀฀฀฀฀฀฀฀฀฀฀฀฀฀฀฀฀฀฀฀฀฀฀฀฀฀฀฀฀฀฀฀฀฀฀฀฀฀฀฀ ฀฀฀฀566,447฀฀฀฀฀฀฀฀฀ ฀฀฀฀477,685฀฀฀฀฀฀฀฀฀฀฀฀฀฀456,305
INVESTING฀ACTIVITIES:
Purchase฀of฀available-for-sale฀securities฀฀฀฀฀฀฀฀฀฀฀฀฀฀฀฀฀฀฀฀฀฀฀฀฀฀฀฀฀฀฀฀฀฀฀฀฀฀฀฀฀฀฀฀฀฀฀฀฀฀฀฀฀฀฀฀฀฀฀฀฀฀฀฀฀฀฀฀฀฀฀฀฀฀฀฀฀฀฀฀฀฀฀฀฀฀฀฀฀ ฀฀฀(323,331฀)฀฀฀฀฀฀฀ ฀฀฀(339,968฀)฀฀฀฀฀฀฀฀฀฀฀฀(184,187฀)
Maturity฀of฀available-for-sale฀securities ฀฀฀฀฀฀฀฀฀฀฀฀฀฀฀฀฀฀฀฀฀฀฀฀฀฀฀฀฀฀฀฀฀฀฀฀฀฀฀฀฀฀฀฀฀฀฀฀฀฀฀฀฀฀฀฀฀฀฀฀฀฀฀฀฀฀฀฀฀฀฀฀฀฀฀฀฀฀฀฀฀฀฀฀฀฀฀฀ ฀฀฀฀180,687฀฀฀฀฀฀฀฀ ฀฀฀฀฀฀78,349฀฀฀฀฀฀฀฀฀฀฀฀฀฀฀฀93,500
Sale฀of฀available-for-sale฀securities฀฀฀฀฀฀฀฀฀฀฀฀฀฀฀฀฀฀฀฀฀฀฀฀฀฀฀฀฀฀฀฀฀฀฀฀฀฀฀฀฀฀฀฀฀฀฀฀฀฀฀฀฀฀฀฀฀฀฀฀฀฀฀฀฀฀฀฀฀฀฀฀฀฀฀฀฀฀฀฀฀฀฀฀฀฀฀฀฀฀฀฀฀฀฀฀ ฀฀฀฀฀฀88,889฀฀฀฀฀฀฀฀ ฀฀฀฀144,760฀฀฀฀฀฀฀฀฀฀฀฀฀฀฀฀46,931
Purchase฀of฀Seattle฀Coffee฀Company,net฀of฀cash฀acquired ฀฀฀฀฀฀฀฀฀฀฀฀฀฀฀฀฀฀฀฀฀฀฀฀฀฀฀฀฀฀฀฀฀฀฀฀฀฀฀฀฀฀฀฀฀฀฀฀฀฀฀฀฀฀฀฀฀฀฀฀฀฀฀฀฀฀฀(69,928฀)฀฀฀฀฀฀฀฀฀฀฀฀฀฀฀฀฀฀฀–฀ ฀ ฀฀฀฀฀฀฀฀฀฀฀฀฀฀฀฀฀฀฀฀ –฀ ฀
Net฀additions฀to฀equity,฀other฀investments฀and฀other฀assets฀฀฀฀฀฀฀฀฀฀฀฀฀฀฀฀฀฀฀฀฀฀฀฀฀฀฀฀฀฀฀฀฀฀฀฀฀฀฀฀฀฀฀฀฀฀฀฀฀฀฀฀฀฀฀฀฀฀฀฀฀ ฀฀฀฀฀(47,259฀)฀฀฀฀฀฀฀ ฀฀฀฀ (15,841฀)฀฀฀฀฀฀฀฀฀฀฀฀฀฀(17,424฀)
Distributions฀from฀equity฀investees ฀฀฀฀฀฀฀฀฀฀฀฀฀฀฀฀฀฀฀฀฀฀฀฀฀฀฀฀฀฀฀฀฀฀฀฀฀฀฀฀฀฀฀฀฀฀฀฀฀฀฀฀฀฀฀฀฀฀฀฀฀฀฀฀฀฀฀฀฀฀฀฀฀฀฀฀฀฀฀฀฀฀฀฀฀฀฀฀฀฀฀฀฀฀฀฀฀฀฀฀฀28,966฀฀฀฀฀฀฀฀฀฀฀฀฀฀฀฀22,834฀฀฀฀฀฀฀฀฀฀฀฀฀฀฀฀16,863
Net฀additions฀to฀property,plant฀and฀equipment ฀฀฀฀฀฀฀฀฀฀฀฀฀฀฀฀฀฀฀฀฀฀฀฀฀฀฀฀฀฀฀฀฀฀฀฀฀฀฀฀฀฀฀฀฀฀฀฀฀฀฀฀฀฀฀฀฀฀฀฀฀฀฀฀฀฀฀฀฀฀฀฀฀฀฀฀ ฀฀฀(357,282฀)฀฀฀฀฀฀฀ ฀฀฀(375,474฀)฀฀฀฀฀฀฀฀฀฀฀฀(384,215฀)
Net฀cash฀used฀by฀investing฀activities ฀฀฀฀฀฀฀฀฀฀฀฀฀฀฀฀฀฀฀฀฀฀฀฀฀฀฀฀฀฀฀฀฀฀฀฀฀฀฀฀฀฀฀฀฀฀฀฀฀฀฀฀฀฀฀฀฀฀฀฀฀฀฀฀฀฀฀฀฀฀฀฀฀฀฀฀฀฀฀฀฀฀฀฀฀฀฀฀฀฀฀฀฀฀฀฀ ฀฀฀(499,258฀)฀฀฀฀฀฀฀ ฀฀฀(485,340฀)฀฀฀฀฀฀฀฀฀฀฀฀(428,532฀)
FINANCING฀ACTIVITIES:
Proceeds฀from฀issuance฀of฀common฀stock฀฀฀฀฀฀฀฀฀฀฀฀฀฀฀฀฀฀฀฀฀฀฀฀฀฀฀฀฀฀฀฀฀฀฀฀฀฀฀฀฀฀฀฀฀฀฀฀฀฀฀฀฀฀฀฀฀฀฀฀฀฀฀฀฀฀฀฀฀฀฀฀฀฀฀฀฀฀฀฀฀฀฀฀฀ ฀฀฀฀107,183฀฀฀฀฀฀฀฀฀ ฀฀฀฀107,467฀฀฀฀฀฀฀฀฀฀฀฀฀฀฀฀59,639
Principal฀payments฀on฀long-term฀debt ฀฀฀฀฀฀฀฀฀฀฀฀฀฀฀฀฀฀฀฀฀฀฀฀฀฀฀฀฀฀฀฀฀฀฀฀฀฀฀฀฀฀฀฀฀฀฀฀฀฀฀฀฀฀฀฀฀฀฀฀฀฀฀฀฀฀฀฀฀฀฀฀฀฀฀฀฀฀฀฀฀฀฀฀฀฀฀฀ ฀฀฀฀฀฀฀฀฀ (710฀)฀฀฀฀฀฀฀ ฀฀฀฀฀฀฀฀฀(697฀)฀฀฀฀฀฀฀฀฀฀฀฀฀฀฀฀฀฀ (685฀)
Repurchase฀of฀common฀stock฀฀฀฀฀฀฀฀฀฀฀฀฀฀฀฀฀฀฀฀฀฀฀฀฀฀฀฀฀฀฀฀฀฀฀฀฀฀฀฀฀฀฀฀฀฀฀฀฀฀฀฀฀฀฀฀฀฀฀฀฀฀฀฀฀฀฀฀฀฀฀฀฀฀฀฀฀฀฀฀฀฀฀฀฀฀฀฀฀฀฀฀฀฀฀฀฀฀฀฀฀ ฀฀฀฀฀(75,710฀)฀฀฀฀฀฀฀ ฀฀฀฀ (52,248฀)฀฀฀฀฀฀฀฀฀฀฀฀฀฀(49,788฀)
Net฀cash฀provided฀by฀financing฀activities ฀฀฀฀฀฀฀฀฀฀฀฀฀฀฀฀฀฀฀฀฀฀฀฀฀฀฀฀฀฀฀฀฀฀฀฀฀฀฀฀฀฀฀฀฀฀฀฀฀฀฀฀฀฀฀฀฀฀฀฀฀฀฀฀฀฀฀฀฀฀฀฀฀฀฀฀฀฀฀฀฀฀฀฀฀฀฀฀฀ ฀฀฀฀฀฀30,763฀฀฀฀฀฀฀฀฀ ฀฀฀฀฀฀54,522฀฀฀฀฀฀฀฀฀฀฀฀฀฀฀฀฀ 9,166
Effect฀of฀exchange฀rate฀changes฀on฀cash฀and฀cash฀equivalents฀฀฀฀฀฀฀฀฀฀฀฀฀฀฀฀฀฀฀฀฀฀฀฀฀฀฀฀฀฀฀฀฀฀฀฀฀฀฀฀฀฀฀฀฀฀฀฀฀฀฀฀฀฀฀฀฀฀฀฀ ฀฀฀฀฀฀฀ 3,278฀฀฀฀฀฀฀฀฀฀฀฀฀฀฀฀฀฀ 1,560฀฀฀฀฀฀฀฀฀฀฀฀฀฀฀฀฀฀฀ (174฀)
Net฀increase฀in฀cash฀and฀cash฀equivalents ฀฀฀฀฀฀฀฀฀฀฀฀฀฀฀฀฀฀฀฀฀฀฀฀฀฀฀฀฀฀฀฀฀฀฀฀฀฀฀฀฀฀฀฀฀฀฀฀฀฀฀฀฀฀฀฀฀฀฀฀฀฀฀฀฀฀฀฀฀฀฀฀฀฀฀฀฀฀฀฀฀฀฀฀฀฀฀฀฀ ฀฀฀฀101,230฀฀฀฀฀฀฀฀฀ ฀฀฀฀฀฀48,427฀฀฀฀฀฀฀฀฀฀฀฀฀฀฀฀36,765
CASH฀AND฀CASH฀EQUIVALENTS:฀฀฀฀฀฀฀฀฀฀฀฀฀฀฀฀฀฀฀฀฀฀฀฀฀฀฀฀฀฀฀฀฀฀฀฀฀฀฀฀฀฀฀฀฀฀฀฀฀฀฀฀฀฀฀฀฀฀฀฀฀฀฀฀฀฀฀฀฀฀฀฀฀฀฀฀฀฀฀฀฀฀฀฀฀฀฀฀฀฀฀฀ ฀฀฀฀฀฀฀฀฀฀฀฀฀฀
Beginning฀of฀period ฀฀฀฀฀฀฀฀฀฀฀฀฀฀฀฀฀฀฀฀฀฀฀฀฀฀฀฀฀฀฀฀฀฀฀฀฀฀฀฀฀฀฀฀฀฀฀฀฀฀฀฀฀฀฀฀฀฀฀฀฀฀฀฀฀฀฀฀฀฀฀฀฀฀฀฀฀฀฀฀฀฀฀฀฀฀฀฀฀฀฀฀฀฀฀฀฀฀฀฀฀฀฀฀฀฀฀฀฀฀฀฀฀฀฀฀฀฀ ฀฀฀฀฀฀99,677฀฀฀฀฀฀฀฀฀ ฀฀฀฀฀฀51,250฀฀฀฀฀฀฀฀฀฀฀฀฀฀฀฀14,485
End฀of฀the฀period฀฀฀฀฀฀฀฀฀฀฀฀฀฀฀฀฀฀฀฀฀฀฀฀฀฀฀฀฀฀฀฀฀฀฀฀฀฀฀฀฀฀฀฀฀฀฀฀฀฀฀฀฀฀฀฀฀฀฀฀฀฀฀฀฀฀฀฀฀฀฀฀฀฀฀฀฀฀฀฀฀฀฀฀฀฀฀฀฀฀฀฀฀฀฀฀฀฀฀฀฀฀฀฀฀฀฀฀฀฀฀฀฀฀฀฀฀฀฀฀ $ ฀฀฀฀200,907฀฀฀฀฀฀ ฀$ ฀฀฀฀฀฀99,677฀฀฀฀฀฀฀ $ ฀฀฀฀฀฀51,250
SUPPLEMENTAL฀DISCLOSURE฀OF฀CASH฀FLOW฀INFORMATION:
Cash฀paid฀during฀the฀year฀for:
Interest ฀฀฀฀฀฀฀฀฀฀฀฀฀฀฀฀฀฀฀฀฀฀฀฀฀฀฀฀฀฀฀฀฀฀฀฀฀฀฀฀฀฀฀฀฀฀฀฀฀฀฀฀฀฀฀฀฀฀฀฀฀฀฀฀฀฀฀฀฀฀฀฀฀฀฀฀฀฀฀฀฀฀฀฀฀฀฀฀฀฀฀฀฀฀฀฀฀฀฀฀฀฀฀฀฀฀฀฀฀฀฀฀฀฀฀฀฀฀฀฀฀฀฀฀฀฀฀฀฀฀฀ $ ฀฀฀฀฀฀฀฀฀฀ 265฀฀฀฀฀฀฀ $ ฀฀฀฀฀฀฀฀฀฀ 303฀฀฀฀฀฀฀ $ ฀฀฀฀฀฀฀฀฀฀ 432
Income฀taxes ฀฀฀฀฀฀฀฀฀฀฀฀฀฀฀฀฀฀฀฀฀฀฀฀฀฀฀฀฀฀฀฀฀฀฀฀฀฀฀฀฀฀฀฀฀฀฀฀฀฀฀฀฀฀฀฀฀฀฀฀฀฀฀฀฀฀฀฀฀฀฀฀฀฀฀฀฀฀฀฀฀฀฀฀฀฀฀฀฀฀฀฀฀฀฀฀฀฀฀฀฀฀฀฀฀฀฀฀฀฀฀฀฀฀฀฀฀฀฀฀฀฀฀ $ ฀฀฀฀140,107฀฀฀฀฀฀฀ $ ฀฀฀฀105,339฀฀฀฀฀฀฀ $ ฀฀฀฀฀฀47,690
SeeNotestoConsolidatedFinancialStatements.