Starbucks 2003 Annual Report Download - page 7
Download and view the complete annual report
Please find page 7 of the 2003 Starbucks annual report below. You can navigate through the pages in the report by either clicking on the pages listed below, or by using the keyword search tool below to find specific information within the annual report.-
 1
1 -
 2
2 -
 3
3 -
 4
4 -
 5
5 -
 6
6 -
 7
7 -
 8
8 -
 9
9 -
 10
10 -
 11
11 -
 12
12 -
 13
13 -
 14
14 -
 15
15 -
 16
16 -
 17
17 -
 18
18 -
19
-
20
-
21
-
22
-
23
-
24
-
25
-
26
-
27
-
28
 |
 |
18 Fiscal2003AnnualReport
Fiscal2003AnnualReport 19
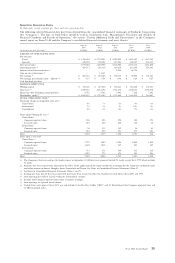
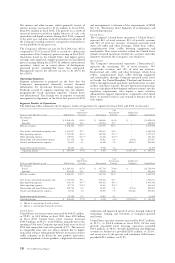
OperatingincomefortheUnitedStatesincreasedby19.7%to
$606.5 million in fiscal 2003, from $506.9 million in fiscal
2002.Operatingmargindecreasedto17.5%ofrelatedrevenues
from 17.9% in the prior year, primarily due to higher green
coffeecostsandpayroll-relatedexpenditures,partiallyoffsetby
fixedoccupancycostsspreadoveranexpandingrevenuebase.
International
Internationaltotalnetrevenuesincreasedby$142.4million,or
30.9%,to$603.1millioninfiscal2003,from$460.7million
in fiscal 2002. International retail revenues increased
$116.3million, or 31.6%, to $484.0 million, primarily due
to the opening of 96 new Company-operated retail stores
in fiscal 2003 and comparable store sales growth of 7%.
The increase in comparable store sales was almost entirely
duetohighertransactionvolumeandref lectstheimproved
operationalexecutionintheUnitedKingdommarket.
International specialty revenues increased $26.1 million, or
28.1%,to$119.1millioninfiscal2003,primarilyduetothe
additionof284newlicensedstoresandresultingincreasesin
royaltyrevenuesfromandproductsalestothoselicensees.
Operating income for International increased by 42.5%
to $5.5 million in fiscal 2003, from $3.8 million in fiscal
2002. International operating margin increased to 0.9%
in fiscal 2003, from 0.8% in fiscal 2002, primarily due to
lower provisions recorded for retail store asset impairment
and disposals of $3.7 million in fiscal 2003 compared to
$13.9 million in fiscal 2002. This was partially offset by
International’sproportionateshareofnetlossesinStarbucks
Japan and a shift in sales mix to lower margin products.
Excluding Canadian operations, operating losses increased
by 11.1% to $18.5 million in fiscal 2003, compared to an
operatinglossof$16.7millioninfiscal2002.
UnallocatedCorporate
Unallocated corporate expenses pertain to functions, such
as executive management, administration, tax, treasury
and information technology infrastructure, that are not
specificallyattributabletotheCompany’soperatingsegments
andincluderelateddepreciationandamortizationexpenses.
Unallocated general and administrative expenses decreased
to$155.2millioninfiscal2003,from$165.6millioninfiscal
2002,primarilyduetoan$18.0millionlitigationsettlement
in fiscal 2002. Depreciation and amortization expenses
increasedto$32.1millioninfiscal2003,from$28.7million
infiscal2002,primarilyduetoexpandedsupportfacilitiesand
capitalspendingforinformationtechnologyenhancements.
Totalunallocatedcorporateexpensesasapercentageoftotal
netrevenuesdecreasedfrom5.9%infiscal2002to4.6%in
fiscal2003.
RESULTSOFOPERATIONS–FISCAL2002
COMPAREDTOFISCAL2001
ConsolidatedResultsofOperations
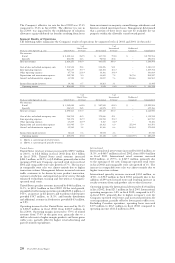
Netrevenuesforthefiscalyearended2002increased24.2%
to$3.3billionfrom$2.6billionforthecorrespondingperiod
infiscal2001.Duringthefiscalyearended2002,Starbucks
derived approximately 85% of total net revenues from its
Company-operated retail stores. Retail revenues increased
25.3% to $2.8 billion for the fiscal year ended 2002, from
$2.2 billion for the corresponding period of fiscal 2001.
Thisincreasewasdueprimarilytotheopeningof614new
Company-operated retail stores in the last 12 months and
comparablestoresalesgrowthof6%,drivenalmostentirely
byincreasedtransactions.
The Company derived the remaining 15% of total net
revenues from its Specialty Operations. Specialty revenues
increased $76.6 million, or 18.3%, to $496.0 million for
the fiscal year ended 2002, from $419.4 million for the
corresponding period in fiscal 2001. Of the total growth,
expandedretaillicensingoperationsprovided$54.1million,
or70.6%,andanincreaseinthegroceryandwarehouseclub
businessprovided$14.7million,or19.2%.
Costofsalesandrelatedoccupancycostsdecreasedto41.0%
of total net revenues in fiscal 2002, from 42.0% in fiscal
2001.Thedecreasewasprimarilyduetoashiftinsalesmix
tohighermarginproducts,suchashandcraftedbeverages,as
wellaslowergreencoffeecosts.Improvementsincostofsales
werepartiallyoffsetbyhigheroccupancycostsduetoincreased
repairandmaintenanceactivitiesonCompany-operatedretail
storesandhigherretailrentexpense.
Store operating expenses as a percentage of retail revenues
increasedto39.7%infiscal2002,from38.9%infiscal2001,
primarilyduetohigherpayroll-relatedexpendituresduetothe
continuing shift in sales to more labor-intensive handcrafted
beverages as well as higher average wage rates. Higher
provisions for retail store asset impairment and disposals of
$26.0millioninfiscal2002comparedto$7.3millioninfiscal
2001alsocontributedtotheunfavorablevariance.
Other operating expenses (expenses associated with the
Company’s Specialty Operations) were 21.4% of specialty
revenues in fiscal 2002, compared to 17.3% in fiscal 2001,
primarilyduetothecontinueddevelopmentoftheCompany’s
international infrastructure, including additional regional
officesandemployeessupportingglobalexpansion,aswellas
higheradvertisingexpendituresfromtheCompany’sonline
initiativesforStarbucks.com.
Depreciationandamortizationexpensesincreasedto$205.6
million in fiscal 2002, from $163.5 million in fiscal 2001,
primarilyduetoanetincreaseof614newCompany-operated
retailstoresinthelast12months.
General and administrative expenses increased to $234.6
millioninfiscal2002,compared to$179.9millioninfiscal
2001. The increase was primarily due to an $18.0 million
charge for the litigation settlement of two California class
actionlawsuits.Excludingthelitigationcharge,generaland
administrativeexpensesincreasedoverthecomparableperiod
infiscal2001duetohigherpayroll-relatedexpenditures.
Operatingincomeincreased12.9%to$316.3millioninfiscal
2002, from $280.2 million in fiscal 2001. The operating
margin decreased to 9.6% of total net revenues in fiscal
2002, compared to 10.6% in fiscal 2001, primarily due to
higher operating expenses partially offset by cost of sales
improvements,asdiscussedabove.
Incomefromequityinvesteeswas$33.4millioninfiscal2002,
comparedto$27.7 millioninfiscal2001.Theincreasewas
mainly attributable to improved profitability of TheNorth
American Coffee Partnership as a result of increased sales
volumefromextensionsofitsproductlineandexpansionof
geographic distribution, as well as improvements in its cost
of goods sold primarily due to manufacturing efficiencies.
Additionally, the net earnings of Starbucks Coffee Korea
Co.,Ltd.improvedasaresultofanincreaseinretail stores
to 53 in fiscal 2002, compared to 24 in fiscal 2001. These
increaseswerepartiallyoffsetbyslightlylowercontributions
fromStarbucksJapanduetolowerprofitabilityaswellasthe
reductionoftheCompany’sownershipinterestfrom50.0%
to40.1%atthebeginningoffiscal2002.
Net interest and other income, which primarily consists
of interest income, decreased to $9.3 million in fiscal
2002, from $10.8 million in fiscal 2001, primarily as a
resultoflowerinterestratesoncash,cashequivalentsand
short-termsecurities.
Gainonsaleofinvestmentontheaccompanyingconsolidated
statements of earnings is the result of the Company’s sale
of 30,000 of its shares of Starbucks Japan on October 10,
2001, at approximately $495 per share, net of related costs.
In connection with this sale, the Company received cash
proceedsof$14.8millionandrecordedagainof$13.4million.
The Company’s ownership interest in Starbucks Japan was
reducedfrom50.0%to47.5%followingthesaleoftheshares.
Also on October10, 2001, Starbucks Japan issued 220,000
shares of common stock at approximately $495 per share,
net of related costs, in an initial public offering in Japan. In
connection with this offering, the Company’s ownership
interestinStarbucksJapanwasreducedfrom47.5%to40.1%.
TheCompanyrecorded“Otheradditionalpaid-incapital”on
theaccompanyingconsolidatedbalancesheetof$39.4million,
reflectingtheincreaseinvalueofitsshareofthenetassetsof
StarbucksJapanrelatedtothestockoffering.