Starbucks 2003 Annual Report Download - page 3
Download and view the complete annual report
Please find page 3 of the 2003 Starbucks annual report below. You can navigate through the pages in the report by either clicking on the pages listed below, or by using the keyword search tool below to find specific information within the annual report.-
 1
1 -
 2
2 -
 3
3 -
 4
4 -
 5
5 -
 6
6 -
 7
7 -
 8
8 -
 9
9 -
 10
10 -
 11
11 -
 12
12 -
 13
13 -
 14
14 -
15
-
16
-
17
-
18
-
19
-
20
-
21
-
22
-
23
-
24
-
25
-
26
-
27
-
28
 |
 |

14 Fiscal2003AnnualReport
Fiscal2003AnnualReport 15
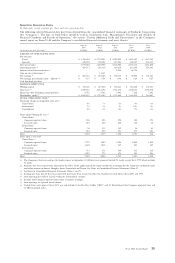
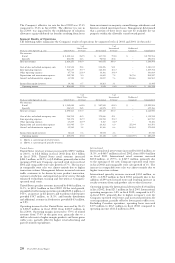
SELECTEDFINANCIALDATA
Inthousands,exceptearningspershareandstoreoperatingdata
ThefollowingselectedfinancialdatahavebeenderivedfromtheconsolidatedfinancialstatementsofStarbucksCorporation
(the“Company”). Thedata set forth below should be read in conjunctionwith “Management’s Discussionand Analysis of
FinancialConditionandResultsofOperations,”thesection“CertainAdditionalRisksandUncertainties”intheCompany’s
annualreportonForm10-KandtheCompany’sconsolidatedfinancialstatementsandnotesthereto.
Sept28,Sept29, Sept30, Oct1,Oct3,
20032002 2001 20001999
Asofandforthefiscalyearended(1) (52Wks) (52Wks) (52Wks) (52Wks) (53Wks)
RESULTSOFOPERATIONSDATA
Netrevenues:
Retail $ 3,449,624 $ 2,792,904 $ 2,229,594 $ 1,823,607 $ 1,423,389
Specialty 625,898 496,004 419,386354,007 263,439
Totalnetrevenues4,075,522 3,288,908 2,648,980 2,177,614 1,686,828
Operatingincome(2) 424,713 316,338 280,219212,190156,641
Internet-relatedinvestmentlosses(3) – – 2,94058,792 –
Gainonsaleofinvestment(3) – 13,361 – – –
Netearnings(2) $ 268,346 $ 212,686 $ 180,335 $ 94,502 $ 101,623
Netearningspercommonshare–diluted(2)(4)$ 0.67 $ 0.54 $ 0.46 $ 0.24 $ 0.27
Cashdividendspershare – – – – –
BALANCESHEETDATA
Workingcapital $ 315,326 $ 310,048 $ 148,661 $ 146,568 $ 135,303
Totalassets(2) 2,729,746 2,214,392 1,783,470 1,435,026 1,188,578
Long-termdebt(includingcurrentportion)5,076 5,786 6,483 7,168 7,691
Shareholders’equity(2) $ 2,082,427 $ 1,723,189 $ 1,374,865 $ 1,148,212 $ 960,887
STOREOPERATINGDATA(5)
Percentagechangeincomparablestoresales:(6)
UnitedStates 9% 7% 5% 9% 6%
International 7% 1% 3% 12% 8%
Consolidated 8% 6% 5% 9% 6%
Storesopenedduringtheyear:(7)
UnitedStates
Company-operatedstores506 503 498 388 394
Licensedstores 315 264 268 342 42
International
Company-operatedstores 96 111 1499653
Licensedstores 284 299 293 177 123
Total 1,201 1,177 1,208 1,003 612
Storesopenatyearend:
UnitedStates(8)
Company-operatedstores 3,779 3,209 2,706 2,208 1,820
Licensedstores 1,422 1,033 769 501 159
International
Company-operatedstores767 671 560 411 315
Licensedstores 1,257 973 674 381 204
Total 7,225 5,886 4,709 3,501 2,498
(1) TheCompany’sfiscalyearendsontheSundayclosesttoSeptember30.Allfiscalyearspresentedinclude52weeks,exceptfiscal1999,whichincludes
53weeks.
(2) AmountshavebeenretroactivelyadjustedfortheeffectoftheapplicationoftheequitymethodofaccountingfortheCompany’sadditionalequity
ownershipinterestsinAustria,Shanghai,Spain,SwitzerlandandTaiwan.SeeNotestoConsolidatedFinancialStatements(Note2).
(3) SeeNotestoConsolidatedFinancialStatements(Notes4and7).
(4) Earningspersharedataforfiscalyearspresentedabovehavebeenrestatedtoreflectthetwo-for-onestocksplitsinfiscal2001and1999.
(5) StoreoperatingdatareflectsCanadawithintheinternationalcategory.
(6) IncludesonlyCompany-operatedstoresopen13monthsorlonger.
(7) Storeopeningsarereportednetofclosures.
(8) UnitedStatesstoresopenatfiscal2003yearendinclude43Seattle’sBestCoffee(“SBC”)and21TorrefazioneItaliaCompany-operatedstoresand
74SBCfranchisedstores.