Starbucks 2003 Annual Report Download - page 5
Download and view the complete annual report
Please find page 5 of the 2003 Starbucks annual report below. You can navigate through the pages in the report by either clicking on the pages listed below, or by using the keyword search tool below to find specific information within the annual report.-
 1
1 -
 2
2 -
 3
3 -
 4
4 -
 5
5 -
 6
6 -
 7
7 -
 8
8 -
 9
9 -
 10
10 -
 11
11 -
 12
12 -
 13
13 -
 14
14 -
 15
15 -
 16
16 -
17
-
18
-
19
-
20
-
21
-
22
-
23
-
24
-
25
-
26
-
27
-
28
 |
 |

16 Fiscal2003AnnualReport
Fiscal2003AnnualReport 17
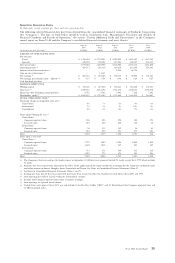
RESULTSOFOPERATIONS–FISCAL2003COMPAREDTOFISCAL2002
The followingtablesets forththe percentagerelationshipto totalnet revenues, unless otherwise indicated, of certain items
includedintheCompany’sconsolidatedstatementsofearnings:
Sept28, Sept29, Sept30,
2003 2002 2001
Fiscalyearend (52Wks) (52Wks) (52Wks)
STATEMENTSOFEARNINGSDATA
Netrevenues:
Retail 84.6% 84.9% 84.2%
Specialty 15.4 15.1 15.8
Totalnetrevenues100.0 100.0100.0
Costofsalesincludingoccupancy 41.4 41.0 42.0
Storeoperatingexpenses(1)40.0 39.7 38.9
Otheroperatingexpenses(2)22.6 21.4 17.3
Depreciationandamortizationexpenses 5.8 6.3 6.2
Generalandadministrativeexpenses 6.0 7.1 6.8
Incomefromequityinvestees 0.9 1.0 1.0
Operatingincome 10.4 9.6 10.6
Interestandotherincome,net 0.3 0.3 0.4
Internet-relatedinvestmentlosses 0.0 0.0 0.1
Gainonsaleofinvestment 0.0 0.4 0.0
Earningsbeforeincometaxes 10.7 10.3 10.9
Incometaxes 4.1 3.8 4.1
Netearnings 6.6% 6.5% 6.8%
(1) Shownasapercentageofretailrevenues.
(2) Shownasapercentageofspecialtyrevenues.
ConsolidatedResultsofOperations
Netrevenuesforthefiscalyearended2003increased23.9%
to$4.1billionfrom$3.3billionforthecorrespondingperiod
infiscal2002.Duringthefiscalyearended2003,Starbucks
derived approximately 85% of total net revenues from its
Company-operated retail stores. Retail revenues increased
23.5% to $3.4 billion for the fiscal year ended 2003, from
$2.8 billion for the corresponding period of fiscal 2002.
This increase was due primarily to the opening of 602
new Company-operated retail stores in the last 12 months,
comparablestoresales growth of 8% drivenalmostentirely
by increased transactions and the July 2003 acquisition of
49 Seattle’s Best Coffee and 21 Torrefazione Italia stores.
Managementbelievesincreasedcustomertrafficcontinuesto
bedrivenbynewproductinnovation,continuedpopularity
of core products, a high level of customer satisfaction and
improved speed of service through enhanced technology,
trainingandexecutionatretailstores.
The Company derived the remaining 15% of total net
revenues from its Specialty Operations. Specialty revenues
increased $129.9 million, or 26.2%, to $625.9 million for
the fiscal year ended 2003, from $496.0 million for the
corresponding period in fiscal 2002. Of the total growth,
expanded Starbucks retail licensing operations provided
$70.3million,or54.1%,broaderdistributionandadditional
accounts in foodservice provided $24.5 million, or 18.9%,
andanincreaseinthegroceryandwarehouseclubbusiness
provided$22.0million,or16.9%.
Costofsalesandrelatedoccupancycostsincreasedto41.4%
oftotalnetrevenuesinfiscal2003,from41.0%infiscal2002.
Theincreasewasprimarilyduetohighergreencoffeecosts
andashiftinspecialtyrevenuemixtolowermarginproducts.
The Company’s green coffee costs reached an historic low
forStarbucksinthesecondandthirdfiscalquartersof2002
andhavegraduallyincreasedsincethen.Theseincreaseswere
partiallyoffsetbyleveragegainedonfixedoccupancycosts
distributedoveranexpandedrevenuebase.
Store operating expenses as a percentage of retail revenues
increasedto40.0%infiscal2003,from39.7%infiscal2002,
primarily due to higher payroll-related and advertising
expenditures. Payroll-related costs have increased primarily
duetoanincreaseinthenumberofpartnerswhoqualifyfor
the Company’s medical and vacation benefits. Advertising
expendituresincreasedinfiscal2003duetopromotionsfor
new and existing products. These increases were partially
offsetbylowerprovisionsforassetimpairmentforinternational
Company-operatedretailstoresin2003ascomparedtothe
prioryear.
Other operating expenses (expenses associated with the
Company’s Specialty Operations) were 22.6% of specialty
revenues in fiscal 2003, compared to 21.4% in fiscal 2002,
primarilyduetohigherpayroll-relatedexpenditurestosupport
the continued development of the Company’s foodservice
distribution network and international infrastructure,
includingregionalofficesandfieldpersonnel.
Depreciationandamortizationexpensesincreasedto$237.8
million in fiscal 2003, from $205.6 million in fiscal 2002,
primarily due to opening 602 Company-operated retail
storesinthelast12monthsandtherefurbishmentofexisting
Company-operatedretailstores.
General and administrative expenses increased to $244.6
million in fiscal 2003, compared to $234.6 million in
fiscal2002,whichincludedan$18.0millionchargeforthe
litigation settlement of two California class action lawsuits.
Excluding the litigation charge, general and administrative
expensesincreased$28.0millionfromthecomparableperiod
infiscal2002duetohigherpayroll-relatedexpendituresand
costs related to the acquisition of Seattle Coffee Company.
Generalandadministrativeexpensesasapercentageoftotal
netrevenuesdecreasedto6.0%infiscal2003,comparedto
7.1%infiscal2002.
Operating income increased 34.3% to $424.7 million
in fiscal 2003, from $316.3 million in fiscal 2002. The
operatingmarginincreasedto10.4%oftotalnetrevenuesin
fiscal2003,comparedto9.6%infiscal2002primarilydue
toleveragegainedonfixedcostsspreadoveranexpanding
revenue base, partially offset by higher green coffee costs,
asdiscussedabove.
Income from equity investees was $38.4 million in fiscal
2003,comparedto$33.4millioninfiscal2002.Theincrease
was mainly attributable to continued strong results by
TheNorth American Coffee Partnership, the Company’s
50% owned ready-to-drink partnership with the Pepsi-
Cola Company, from expanded product lines, lower direct
costsandmanufacturingefficiencies.Partiallyoffsettingthis
increase was the Company’s proportionate share of the net
losses of Starbucks Japan, Ltd. (“Starbucks Japan”) in fiscal
2003,comparedtoanetprofitinfiscal2002,primarilydue
toloweraveragesalesperstore.