Starbucks 2003 Annual Report Download - page 8
Download and view the complete annual report
Please find page 8 of the 2003 Starbucks annual report below. You can navigate through the pages in the report by either clicking on the pages listed below, or by using the keyword search tool below to find specific information within the annual report.-
 1
1 -
 2
2 -
 3
3 -
 4
4 -
 5
5 -
 6
6 -
 7
7 -
 8
8 -
 9
9 -
 10
10 -
 11
11 -
 12
12 -
 13
13 -
 14
14 -
 15
15 -
 16
16 -
 17
17 -
 18
18 -
 19
19 -
20
-
21
-
22
-
23
-
24
-
25
-
26
-
27
-
28
 |
 |

20 Fiscal2003AnnualReport
Fiscal2003AnnualReport 21
TheCompany’seffectivetaxrateforfiscal2002was37.3%
compared to 37.4%in fiscal 2001.Theeffectivetax rate in
fiscal 2001 was impacted by the establishment of valuation
allowancesagainstdeferredtaxbenefitsresultingfromlosses
frominvestmentsinmajority-ownedforeignsubsidiariesand
Internet-related investmentlosses.Managementdetermined
that a portion of these losses may not be realizable for tax
purposeswithintheallowablecarryforwardperiod.
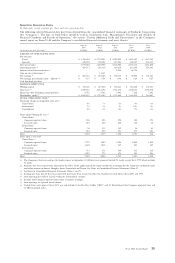
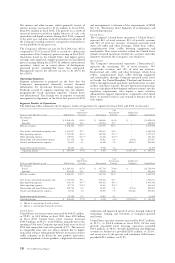
SegmentResultsofOperations
ThefollowingtablessummarizetheCompany’sresultsofoperationsbysegmentforfiscal2002and2001(inthousands):
%of %of
UnitedStates International Unallocated
FiscalyearendedSeptember29,2002UnitedStates RevenueInternational Revenue Corporate Consolidated
Netrevenues:
Retail $ 2,425,163 85.7% $ 367,741 79.8% $ – $2,792,904
Specialty 403,090 14.3 92,914 20.2 – 496,004
Totalnetrevenues 2,828,253 100.0 460,655 100.0 – 3,288,908
Costofsalesandrelatedoccupancycosts 1,114,535 39.4 235,476 51.1 – 1,350,011
Storeoperatingexpenses 961,617 39.7(1) 148,165 40.3(1) – 1,109,782
Otheroperatingexpenses 87,718 21.8(2) 18,366 19.8(2) – 106,084
Depreciationandamortizationexpenses 142,752 5.0 34,069 7.4 28,736 205,557
Generalandadministrativeexpenses 33,928 1.2 35,007 7.6 165,646 234,581
Incomefromequityinvestees 19,182 0.7 14,263 3.1 – 33,445
Operatingincome $ 506,885 17.9% $ 3,835 0.8% $(194,382) $ 316,338
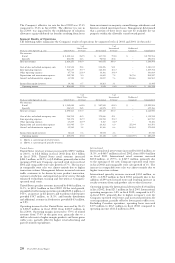
%of %of
UnitedStates International Unallocated
FiscalyearendedSeptember30,2001UnitedStates RevenueInternational Revenue Corporate Consolidated
Netrevenues:
Retail $ 1,942,052 84.5% $ 287,542 82.1% $ – $2,229,594
Specialty 356,511 15.5 62,875 17.9 – 419,386
Totalnetrevenues 2,298,563 100.0 350,417 100.0 – 2,648,980
Costofsalesandrelatedoccupancycosts 940,705 40.9 172,080 49.1 – 1,112,785
Storeoperatingexpenses 755,175 38.9(1) 112,782 39.2(1) – 867,957
Otheroperatingexpenses 67,239 18.9(2) 5,167 8.2(2) – 72,406
Depreciationandamortizationexpenses 113,945 5.0 24,162 6.9 25,394 163,501
Generalandadministrativeexpenses 33,289 1.4 30,160 8.6 116,403 179,852
Incomefromequityinvestees 12,668 0.6 15,072 4.3 – 27,740
Operatingincome $ 400,878 17.4% $ 21,138 6.0% $(141,797) $ 280,219
(1) Shownasapercentageofretailrevenues.
(2) Shownasapercentageofspecialtyrevenues.
UnitedStates
UnitedStatestotalnetrevenuesincreasedby$529.7million,
or 23.0%, to $2.8 billion in fiscal 2002 from $2.3 billion
in fiscal 2001. United States retail revenues increased
$483.1million,or24.9%,to$2.4billion,primarilyduetothe
openingof503newCompany-operatedretailstoresinfiscal
2002andcomparablestoresalesgrowthof7%.Theincrease
in comparable store sales was almost entirely due to higher
transactionvolume.Managementbelievesincreasedcustomer
traffic continues to be driven by new product innovation,
customersatisfactionandimprovedspeedofservicethrough
enhanced technology, training and execution at Company-
operatedretailstores.
UnitedStatesspecialtyrevenuesincreasedby$46.6million,or
13.1%,to$403.1millioninfiscal2002.Ofthetotalgrowth,
expandedretaillicensingoperationsprovided$25.4million,or
54.5%,anincreaseinthegroceryandwarehouseclubbusiness
provided $14.7 million, or 31.5%, and broader distribution
andadditionalaccountsinfoodserviceprovided$4.3million,
or9.2%.
OperatingincomefortheUnitedStatesincreasedby26.4%
to $506.9 million in fiscal 2002, from $400.9 million in
fiscal2001.Operatingmarginincreasedto17.9%ofrelated
revenues from 17.4% in the prior year, primarily due to a
shiftinsalesmixtohighermarginproductsandlowergreen
coffeecosts,partiallyoffsetbyhigherretailadvertisingand
payroll-relatedexpenditures.
International
Internationaltotalnetrevenuesincreasedby$110.2million,or
31.5%,to$460.7millioninfiscal2002,from$350.4million
in fiscal 2001. International retail revenues increased
$80.2million, or 27.9%, to $367.7 million, primarily due
to the opening of 111 new Company-operated retail stores
infiscal2002andcomparablestoresalesgrowthof1%.The
increaseincomparablestoresaleswasalmostentirelydueto
highertransactionvolume.
International specialty revenues increased $30.0 million, or
47.8%,to$92.9millioninfiscal2002,primarilyduetothe
additionof299newlicensedstoresandresultingincreasesin
royaltyrevenuesfromandproductsalestothoselicensees.
OperatingincomeforInternationaldecreasedto$3.8million
infiscal2002,from$21.1millioninfiscal2001.International
operatingmarginwas0.8%infiscal2002,comparedto6.0%
in fiscal 2001, primarily due to higher occupancy costs for
Company-operatedretailstoresandincreasedprovisionsfor
assetimpairment,partiallyoffsetbylowergreencoffeecosts.
Excluding Canadian operations, operating losses increased
$17.9 million to $16.7 million in fiscal 2002, compared to
operatingincomeof$1.2millionin2001.