Starbucks 2003 Annual Report Download - page 6
Download and view the complete annual report
Please find page 6 of the 2003 Starbucks annual report below. You can navigate through the pages in the report by either clicking on the pages listed below, or by using the keyword search tool below to find specific information within the annual report.-
 1
1 -
 2
2 -
 3
3 -
 4
4 -
 5
5 -
 6
6 -
 7
7 -
 8
8 -
 9
9 -
 10
10 -
 11
11 -
 12
12 -
 13
13 -
 14
14 -
 15
15 -
 16
16 -
 17
17 -
18
-
19
-
20
-
21
-
22
-
23
-
24
-
25
-
26
-
27
-
28
 |
 |

18 Fiscal2003AnnualReport
Fiscal2003AnnualReport 19
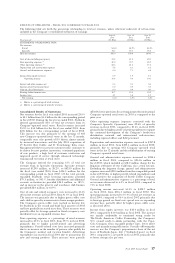
Net interest and other income, which primarily consists of
interest income, increased to $11.6 million in fiscal 2003,
from$9.3millioninfiscal2002.Thegrowthwasaresultof
increased interest received on higher balances of cash, cash
equivalentsandliquidsecuritiesduringfiscal2003,compared
totheprioryear,andgainsrealizedonmarketrevaluationsof
theCompany’stradingsecurities,comparedtorealizedlosses
onthisportfoliointheprioryear.
TheCompany’seffectivetaxrateforfiscal2003was38.5%
comparedto37.3%infiscal2002asaresultofashiftinthe
compositionoftheCompany’spretaxearningsinfiscal2003.
Operations based in the United States had higher pretax
earningsandcomprisedahigherproportionofconsolidated
pretaxearningsduringfiscal2003.Inaddition,international
operations, which are in various phases of development,
generated greater nondeductible losses than anticipated.
Management expects the effective tax rate to be 38.0% for
fiscal2004.
OperatingSegments
Segment information is prepared on the basis that the
Company’s management internally reviews financial
information for operational decision making purposes.
Starbucks revised its segment reporting into two distinct,
geographically based operating segments: United States
and International. This change was in response to internal
managementrealignmentsinthefiscalfirstquarterof2004
and management’s evaluation of the requirements of SFAS
No. 131,“DisclosuresaboutSegmentsofan Enterprise and
RelatedInformation.”
UnitedStates
The Company’s United States operations (“United States”)
represent 86% of retail revenues, 81% of specialty revenues
and 85% of total net revenues. Company-operated retail
stores sell coffee and other beverages, whole bean coffees,
complementary food, coffee brewing equipment and
merchandise. Non-retail activities within the United States
include:licensedoperations,foodserviceaccountsandother
initiativesrelatedtotheCompany’scorebusinesses.
International
The Company’s international operations (“International”)
represent the remaining 14% of retail revenues, 19%
of specialty revenues and 15% of total net revenues.
International sells coffee and other beverages, whole bean
coffees, complementary food, coffee brewing equipment
and merchandise through Company-operated retail stores
inCanada,theUnitedKingdom,ThailandandAustralia,as
wellasthroughlicensedoperationsandfoodserviceaccounts
intheseandothercountries.BecauseInternationaloperations
areinanearlyphaseofdevelopmentandhavecountry-specific
regulatory requirements, they require a more extensive
administrativesupportorganization,comparedtotheUnited
States,toprovideresourcesandrespondtobusinessneedsin
eachregion.
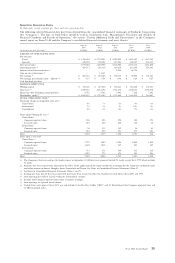
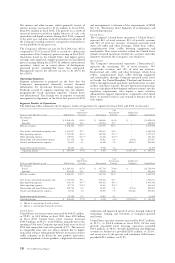
SegmentResultsofOperations
ThefollowingtablessummarizetheCompany’sresultsofoperationsbysegmentforfiscal2003and2002(inthousands):
%of %of
UnitedStates International Unallocated
FiscalyearendedSeptember28,2003UnitedStates RevenueInternational Revenue Corporate Consolidated
Netrevenues:
Retail $ 2,965,618 85.4% $ 484,006 80.3% $ – $3,449,624
Specialty 506,834 14.6 119,064 19.7 – 625,898
Totalnetrevenues 3,472,452 100.0 603,070 100.0 – 4,075,522
Costofsalesandrelatedoccupancycosts 1,363,267 39.3 322,661 53.5 – 1,685,928
Storeoperatingexpenses 1,199,020 40.4(1) 180,554 37.3(1) – 1,379,574
Otheroperatingexpenses 119,960 23.7(2) 21,386 18.0(2) – 141,346
Depreciationandamortizationexpenses 167,138 4.8 38,563 6.4 32,106 237,807
Generalandadministrativeexpenses 45,007 1.3 44,352 7.4 155,191 244,550
Incomefromequityinvestees 28,484 0.8 9,912 1.6 – 38,396
Operatingincome $ 606,544 17.5% $ 5,466 0.9% $(187,297) $ 424,713
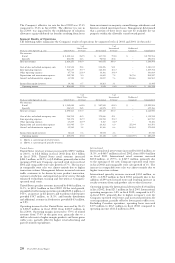
%of %of
UnitedStates International Unallocated
FiscalyearendedSeptember29,2002UnitedStates RevenueInternational Revenue Corporate Consolidated
Netrevenues:
Retail $ 2,425,163 85.7% $ 367,741 79.8% $ – $2,792,904
Specialty 403,090 14.3 92,914 20.2 – 496,004
Totalnetrevenues 2,828,253 100.0 460,655 100.0 – 3,288,908
Costofsalesandrelatedoccupancycosts 1,114,535 39.4 235,476 51.1 – 1,350,011
Storeoperatingexpenses 961,617 39.7(1) 148,165 40.3(1) – 1,109,782
Otheroperatingexpenses 87,718 21.8(2) 18,366 19.8(2) – 106,084
Depreciationandamortizationexpenses 142,752 5.0 34,069 7.4 28,736 205,557
Generalandadministrativeexpenses 33,928 1.2 35,007 7.6 165,646 234,581
Incomefromequityinvestees 19,182 0.7 14,263 3.1 - 33,445
Operatingincome $ 506,885 17.9% $ 3,835 0.8% $(194,382) $ 316,338
(1) Shownasapercentageofretailrevenues.
(2) Shownasapercentageofspecialtyrevenues.
UnitedStates
UnitedStatestotalnetrevenuesincreasedby$644.2million,
or 22.8%, to $3.5 billion in fiscal 2003 from $2.8 billion
in fiscal 2002. United States retail revenues increased
$540.5million,or22.3%,to$3.0billion,primarilyduetothe
openingof506newCompany-operatedretailstoresinfiscal
2003andcomparablestoresalesgrowthof9%.Theincrease
in comparable store sales was almost entirely due to higher
transactionvolume.Managementbelievesincreasedcustomer
traffic continues to be driven by new product innovation,
continuedpopularityofcoreproducts,ahighlevelofcustomer
satisfactionandimprovedspeedofservicethroughenhanced
technology, training and execution at Company-operated
retailstores.
UnitedStatesspecialtyrevenuesincreasedby$103.7million,
or 25.7%, to $506.8 million in fiscal 2003. Of the total
growth, expanded retail licensing operations provided
$50.0million,or48.2%,broaderdistributionandadditional
accounts in foodservice provided $24.5 million, or 23.6%,
andanincreaseinthegroceryandwarehouseclubbusiness
provided$22.0million,or21.2%.