Symantec 2009 Annual Report Download - page 123
Download and view the complete annual report
Please find page 123 of the 2009 Symantec annual report below. You can navigate through the pages in the report by either clicking on the pages listed below, or by using the keyword search tool below to find specific information within the annual report.-
 1
1 -
2
-
3
-
4
-
5
-
6
-
7
-
8
-
9
-
10
-
11
-
12
-
13
-
14
-
15
-
16
-
17
-
18
-
19
-
20
-
21
-
22
-
23
-
24
-
25
-
26
-
27
-
28
-
29
-
30
-
31
-
32
-
33
-
34
-
35
-
36
-
37
-
38
-
39
-
40
-
41
-
42
-
43
-
44
-
45
-
46
-
47
-
48
-
49
-
50
-
51
-
52
-
53
-
54
-
55
-
56
-
57
-
58
-
59
-
60
-
61
-
62
-
63
-
64
-
65
-
66
-
67
-
68
-
69
-
70
-
71
-
72
-
73
-
74
-
75
-
76
-
77
-
78
-
79
-
80
-
81
-
82
-
83
-
84
-
85
-
86
-
87
-
88
-
89
-
90
-
91
-
92
-
93
-
94
-
95
-
96
-
97
-
98
-
99
-
100
-
101
-
102
-
103
-
104
-
105
-
106
-
107
-
108
-
109
-
110
-
111
-
112
-
 113
113 -
 114
114 -
 115
115 -
 116
116 -
 117
117 -
 118
118 -
 119
119 -
 120
120 -
 121
121 -
 122
122 -
 123
123 -
 124
124 -
 125
125 -
 126
126 -
 127
127 -
 128
128 -
 129
129 -
 130
130 -
 131
131 -
 132
132 -
 133
133 -
134
-
135
-
136
-
137
-
138
-
139
-
140
-
141
-
142
-
143
-
144
-
145
-
146
-
147
-
148
-
149
-
150
-
151
-
152
-
153
-
154
-
155
-
156
-
157
-
158
-
159
-
160
-
161
-
162
-
163
-
164
-
165
-
166
-
167
 |
 |

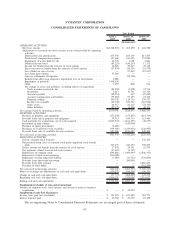
SYMANTEC CORPORATION
CONSOLIDATED STATEMENTS OF CASH FLOWS
April 3,
2009
March 28,
2008
March 30,
2007
(In thousands)
Year Ended
OPERATING ACTIVITIES:
Net (loss) income . . . . . . . . . . . . . . . . . . . . . . . . . . . . . . . . . . . . . . . . . . . $(6,728,870) $ 463,850 $ 404,380
Adjustments to reconcile net (loss) income to net cash provided by operating
activities:
Depreciation and amortization . . . . . . . . . . . . . . . . . . . . . . . . . . . . . . . . . 837,358 824,109 811,443
Stock-based compensation expense. . . . . . . . . . . . . . . . . . . . . . . . . . . . . . 157,464 163,695 153,880
Impairment of assets held for sale . . . . . . . . . . . . . . . . . . . . . . . . . . . . . . 46,592 2,200 2,841
Deferred income taxes . . . . . . . . . . . . . . . . . . . . . . . . . . . . . . . . . . . . . . (89,224) (180,215) 11,173
Income tax benefit from the exercise of stock options . . . . . . . . . . . . . . . . . 14,026 29,443 43,118
Excess income tax benefit from the exercise of stock options. . . . . . . . . . . . (17,878) (26,151) (25,539)
Loss (Gain) on sale of assets . . . . . . . . . . . . . . . . . . . . . . . . . . . . . . . . . . — 97,463 (19,937)
Loss from joint venture . . . . . . . . . . . . . . . . . . . . . . . . . . . . . . . . . . . . . 53,062 — —
Gain on settlements of litigation . . . . . . . . . . . . . . . . . . . . . . . . . . . . . . . — (58,500) —
Realized and other than temporary impairment loss on investments. . . . . . . . 6,068 — —
Impairment of goodwill . . . . . . . . . . . . . . . . . . . . . . . . . . . . . . . . . . . . . 7,418,574 — —
Other . . . . . . . . . . . . . . . . . . . . . . . . . . . . . . . . . . . . . . . . . . . . . . . . . . 7,439 (894) 912
Net change in assets and liabilities, excluding effects of acquisitions:
Trade accounts receivable, net . . . . . . . . . . . . . . . . . . . . . . . . . . . . . . . (84,958) (7,002) 33,714
Inventories . . . . . . . . . . . . . . . . . . . . . . . . . . . . . . . . . . . . . . . . . . . . 5,813 10,791 10,324
Accounts payable . . . . . . . . . . . . . . . . . . . . . . . . . . . . . . . . . . . . . . . . (48,994) 667 (25,623)
Accrued compensation and benefits . . . . . . . . . . . . . . . . . . . . . . . . . . . (55,092) 97,133 23,169
Deferred revenue . . . . . . . . . . . . . . . . . . . . . . . . . . . . . . . . . . . . . . . . 140,728 126,716 399,517
Income taxes payable . . . . . . . . . . . . . . . . . . . . . . . . . . . . . . . . . . . . . (28,702) 196,567 (181,926)
Other assets. . . . . . . . . . . . . . . . . . . . . . . . . . . . . . . . . . . . . . . . . . . . 66,317 81,115 (23,332)
Other liabilities . . . . . . . . . . . . . . . . . . . . . . . . . . . . . . . . . . . . . . . . . (29,125) (2,334) 48,121
Net cash provided by operating activities . . . . . . . . . . . . . . . . . . . . . . . . . . . . . 1,670,598 1,818,653 1,666,235
INVESTING ACTIVITIES:
Purchase of property and equipment . . . . . . . . . . . . . . . . . . . . . . . . . . . . . . (272,240) (273,807) (419,749)
Proceeds from sale of property and equipment . . . . . . . . . . . . . . . . . . . . . . . 39,713 104,715 121,464
Cash payments for acquisitions, net of cash acquired . . . . . . . . . . . . . . . . . . . (1,063,367) (1,162,455) (46,673)
Investment in joint venture . . . . . . . . . . . . . . . . . . . . . . . . . . . . . . . . . . . . . — (150,000) —
Purchase of equity investments . . . . . . . . . . . . . . . . . . . . . . . . . . . . . . . . . . (2,000) — —
Purchases of available-for-sale securities . . . . . . . . . . . . . . . . . . . . . . . . . . . (349,043) (1,233,954) (226,905)
Proceeds from sales of available-for-sale securities . . . . . . . . . . . . . . . . . . . . 685,000 1,189,283 349,408
Net cash used in investing activities . . . . . . . . . . . . . . . . . . . . . . . . . . . . . . . . (961,937) (1,526,218) (222,455)
FINANCING ACTIVITIES:
Sale of common stock warrants. . . . . . . . . . . . . . . . . . . . . . . . . . . . . . . . . . — — 326,102
Net proceeds from sales of common stock under employee stock benefit
plans . . . . . . . . . . . . . . . . . . . . . . . . . . . . . . . . . . . . . . . . . . . . . . . . . . 229,133 224,152 230,295
Excess income tax benefit from the exercise of stock options . . . . . . . . . . . . . 17,878 26,151 25,539
Tax payments related to restricted stock issuance . . . . . . . . . . . . . . . . . . . . . . (15,607) (4,137) —
Repurchase of common stock . . . . . . . . . . . . . . . . . . . . . . . . . . . . . . . . . . . (699,881) (1,499,995) (2,846,312)
Repayment of short-term borrowing. . . . . . . . . . . . . . . . . . . . . . . . . . . . . . . (200,000) — —
Repayment of other long-term liability . . . . . . . . . . . . . . . . . . . . . . . . . . . . . (7,630) (11,724) (520,000)
Proceeds from short-term borrowing . . . . . . . . . . . . . . . . . . . . . . . . . . . . . . — 200,000 —
Proceeds from debt issuance . . . . . . . . . . . . . . . . . . . . . . . . . . . . . . . . . . . . — — 2,067,299
Purchase of bond hedge . . . . . . . . . . . . . . . . . . . . . . . . . . . . . . . . . . . . . . . — — (592,490)
Net cash used in financing activities . . . . . . . . . . . . . . . . . . . . . . . . . . . . . . . . (676,107) (1,065,553) (1,309,567)
Effect of exchange rate fluctuations on cash and cash equivalents . . . . . . . . . . . . (130,277) 104,309 109,199
Change in cash and cash equivalents . . . . . . . . . . . . . . . . . . . . . . . . . . . . . . . . (97,723) (668,809) 243,412
Beginning cash and cash equivalents . . . . . . . . . . . . . . . . . . . . . . . . . . . . . . . . 1,890,225 2,559,034 2,315,622
Ending cash and cash equivalents . . . . . . . . . . . . . . . . . . . . . . . . . . . . . . . . . . $ 1,792,502 $ 1,890,225 2,559,034
Supplemental schedule of non-cash transactions:
Issuance of common stock, stock options, and restricted stock for business
acquisitions . . . . . . . . . . . . . . . . . . . . . . . . . . . . . . . . . . . . . . . . . . . . . . . $ — $ 35,054 —
Supplemental cash flow disclosures:
Income taxes paid (net of refunds) . . . . . . . . . . . . . . . . . . . . . . . . . . . . . . . . . $ 321,039 $ 181,089 384,771
Interest expense paid. . . . . . . . . . . . . . . . . . . . . . . . . . . . . . . . . . . . . . . . . . . $ 22,568 $ 22,659 10,108
The accompanying Notes to Consolidated Financial Statements are an integral part of these statements.
63