Symantec 2009 Annual Report Download - page 6
Download and view the complete annual report
Please find page 6 of the 2009 Symantec annual report below. You can navigate through the pages in the report by either clicking on the pages listed below, or by using the keyword search tool below to find specific information within the annual report.-
 1
1 -
 2
2 -
 3
3 -
 4
4 -
 5
5 -
 6
6 -
 7
7 -
 8
8 -
 9
9 -
 10
10 -
 11
11 -
 12
12 -
 13
13 -
 14
14 -
 15
15 -
 16
16 -
 17
17 -
18
-
19
-
20
-
21
-
22
-
23
-
24
-
25
-
26
-
27
-
28
-
29
-
30
-
31
-
32
-
33
-
34
-
35
-
36
-
37
-
38
-
39
-
40
-
41
-
42
-
43
-
44
-
45
-
46
-
47
-
48
-
49
-
50
-
51
-
52
-
53
-
54
-
55
-
56
-
57
-
58
-
59
-
60
-
61
-
62
-
63
-
64
-
65
-
66
-
67
-
68
-
69
-
70
-
71
-
72
-
73
-
74
-
75
-
76
-
77
-
78
-
79
-
80
-
81
-
82
-
83
-
84
-
85
-
86
-
87
-
88
-
89
-
90
-
91
-
92
-
93
-
94
-
95
-
96
-
97
-
98
-
99
-
100
-
101
-
102
-
103
-
104
-
105
-
106
-
107
-
108
-
109
-
110
-
111
-
112
-
113
-
114
-
115
-
116
-
117
-
118
-
119
-
120
-
121
-
122
-
123
-
124
-
125
-
126
-
127
-
128
-
129
-
130
-
131
-
132
-
133
-
134
-
135
-
136
-
137
-
138
-
139
-
140
-
141
-
142
-
143
-
144
-
145
-
146
-
147
-
148
-
149
-
150
-
151
-
152
-
153
-
154
-
155
-
156
-
157
-
158
-
159
-
160
-
161
-
162
-
163
-
164
-
165
-
166
-
167
 |
 |

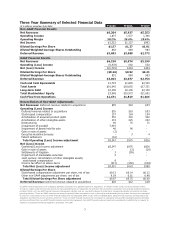
Three Year Summary of Selected Financial Data
($ in millions, except per share data)
FY2009 FY2008 FY2007
Non-GAAP Financial Results
Net Revenues $6,204 $5,937 $5,253
Operating Income 1,877 1,577 1,346
Operating Margin
30.2% 26.6% 25.6%
Net Income $1,322 $1,127 $992
Diluted Earnings Per Share $1.57 $1.27 $1.01
Diluted Weighted-Average Shares Outstanding 842 884 983
Deferred Revenue $3,083 $3,088 $2,772
GAAP Financial Results
Net Revenues $6,150 $5,874 $5,199
Operating (Loss) Income (6,470) 602 520
Net (Loss) Income $(6,729) $464 $404
Diluted Earnings Per Share ($8.10) $0.52 $0.41
Diluted Weighted-Average Shares Outstanding 831 884 983
Deferred Revenue $3,063 $3,077 $2,754
Cash and Cash Equivalents $1,793 $1,890 $2,559
Total Assets $10,645 $18,092 $17,751
Long-term Debt $2,100 $2,100 $2,100
Total Stockholders’ Equity $3,948 $10,973 $11,602
Cash Flow from Operations $1,671 $1,819 $1,666
Reconciliation of Non-GAAP Adjustments
Net Revenues: Deferred revenue related to acquisitions $55 $63 $53
Operating (Loss) Income
Deferred revenue related to acquisitions $55 $63 $53
Stock-based compensation 157 164 154
Amortization of acquired product rights 352 349 342
Amortization of other intangible assets 233 225 202
Restructuring 96 75 71
Impairment of goodwill 7,419 - -
Impairment of assets held for sale 46 96 -
Gain on sale of assets (1) - -
Executive incentive bonuses - 3 4
Patent settlement (10) - -
Total Operating (Loss) Income adjustment $8,347 $975 $826
Net (Loss) Income
Operating (Loss) Income adjustment $8,347 $975 $826
Gain on sale of assets - (3) (20)
Settlements of litigation 3 (59) -
Impairment of marketable securities 4 - -
Joint venture: Amortization of other intangible assets/
stock-based compensation 8 - -
Income tax effect on above items (311) (250) (218)
Total Net (Loss) Income adjustment $8,051 $663 $588
Diluted Earnings Per Share
Stock-based compensation adjustment per share, net of tax $0.13 $0.14 $0.12
Other non-GAAP adjustments per share, net of tax 9.54 0.61 0.48
Total Diluted Earnings Per Share adjustment $9.67 $0.75 $0.60
Deferred Revenue: Deferred revenue related to acquisitions $20 $12 $18
Our GAAP results of operations have undergone significant change due to a goodwill impairment, acquisitions, the impact of SFAS 123(R) and other corporate events.
To help our readers understand our past and future financial performance, we supplement the financials that we provide in accordance with generally accepted accounting
principles (GAAP) with non-GAAP financial measures. Management regularly uses our non-GAAP measures to understand, manage and evaluate our business and make
operating decisions. These non-GAAP measures are among the primary factors management uses in planning for and forecasting future periods. Investors are encouraged
to review the reconciliation of our non-GAAP financial measures to the comparable GAAP results, which is provided above, attached to our quarterly earnings release and
available on our Web site at www.symantec.com/invest. These non-GAAP financial measures are not prepared in accordance with generally accepted accounting principles
and may be different from non-GAAP financial measures used by other companies. Non-GAAP financial measures should not be considered a substitute for, or superior to,
measures of financial performance prepared in accordance with GAAP.
5