Symantec 2014 Annual Report Download - page 6
Download and view the complete annual report
Please find page 6 of the 2014 Symantec annual report below. You can navigate through the pages in the report by either clicking on the pages listed below, or by using the keyword search tool below to find specific information within the annual report.-
 1
1 -
 2
2 -
 3
3 -
 4
4 -
 5
5 -
 6
6 -
 7
7 -
 8
8 -
 9
9 -
 10
10 -
 11
11 -
 12
12 -
 13
13 -
 14
14 -
 15
15 -
 16
16 -
 17
17 -
18
-
19
-
20
-
21
-
22
-
23
-
24
-
25
-
26
-
27
-
28
-
29
-
30
-
31
-
32
-
33
-
34
-
35
-
36
-
37
-
38
-
39
-
40
-
41
-
42
-
43
-
44
-
45
-
46
-
47
-
48
-
49
-
50
-
51
-
52
-
53
-
54
-
55
-
56
-
57
-
58
-
59
-
60
-
61
-
62
-
63
-
64
-
65
-
66
-
67
-
68
-
69
-
70
-
71
-
72
-
73
-
74
-
75
-
76
-
77
-
78
-
79
-
80
-
81
-
82
-
83
-
84
-
85
-
86
-
87
-
88
-
89
-
90
-
91
-
92
-
93
-
94
-
95
-
96
-
97
-
98
-
99
-
100
-
101
-
102
-
103
-
104
-
105
-
106
-
107
-
108
-
109
-
110
-
111
-
112
-
113
-
114
-
115
-
116
-
117
-
118
-
119
-
120
-
121
-
122
-
123
-
124
-
125
-
126
-
127
-
128
-
129
-
130
-
131
-
132
-
133
-
134
-
135
-
136
-
137
-
138
-
139
-
140
-
141
-
142
-
143
-
144
-
145
-
146
-
147
-
148
-
149
-
150
-
151
-
152
-
153
-
154
-
155
-
156
-
157
-
158
-
159
-
160
-
161
-
162
-
163
-
164
-
165
-
166
-
167
-
168
-
169
-
170
-
171
-
172
-
173
-
174
-
175
-
176
-
177
-
178
-
179
-
180
-
181
-
182
-
183
 |
 |

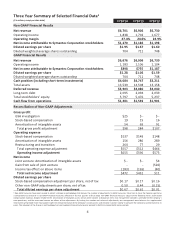
Three Year Summary of Selected Financial Data1
($ in millions, except per share data)
FY2014 FY2013 FY2012
Non-GAAP Financial Results
Net revenue $6,701 $6,906 $6,730
Operating income 1,838 1,702 1,677
Operating margin 27.4% 24.6% 24.9%
Net income attributable to Symantec Corporation stockholders $1,370 $1,186 $1,198
Diluted earnings per share $1.95 $1.67 $1.60
Diluted weighted-average shares outstanding 704 711 748
GAAP Financial Results
Net revenue $6,676 $6,906 $6,730
Operating income 1,183 1,106 1,104
Net income attributable to Symantec Corporation stockholders $898 $755 $1,187
Diluted earnings per share $1.28 $1.06 $1.59
Diluted weighted-average shares outstanding 704 711 748
Cash position (including short-term investments) $4,084 $4,747 $3,211
Total assets 13,539 14,508 13,158
Deferred revenue $3,903 $4,080 $4,040
Long-term debt 2,095 2,094 2,039
Total stockholders’ equity 5,797 5,476 5,237
Cash flow from operations $1,281 $1,593 $1,901
Reconciliation of Non-GAAP Adjustments
Gross profit
GSA investigation $25 $ - $ -
Stock-based compensation 19 15 16
Amortization of intangible assets 54 69 91
Total gross profit adjustment $98 $84 $107
Operating expense
Stock-based compensation $137 $149 $148
Amortization of intangible assets 156 286 289
Restructuring and transition 264 77 29
Total operating expense adjustment $557 $512 $466
Operating income adjustment $655 $596 $573
Net income
Joint venture: Amortization of intangible assets $ - $ - $4
Gain from sale of joint venture - - (526)
Income tax effect on above items (183) (165) (40)
Total net income adjustment $472 $431 $11
Diluted earnings per share
Stock-based compensation adjustment per share, net of tax $0.17 $0.17 $0.16
Other non-GAAP adjustments per share, net of tax 0.50 0.44 (0.15)
Total diluted earnings per share adjustment $0.67 $0.61 $0.01
1Non-GAAP measures have been revised to reflect a change in methodology that reduces the number of adjustments to GAAP measures. From time to time, the Company performs
a comprehensive review of its non-GAAP financial measures. Effective in the first quarter of fiscal 2015, non-GAAP financial measures adjust for the following items: stock-based
compensation expense; charges related to the amortization of intangible assets; certain other income and expense items that management considers unrelated to the Company’s
core operations; and the associated income tax effects of the adjustments. By limiting the number and nature of adjustments, our management team believes this supplemental
information will provide more meaningful insight into the performance of the Company’s core business and enhance investors’ ability to compare the Company’s performance to its
peers. The adoption of the change in methodology has been applied retrospectively to prior periods to facilitate comparability across periods.
4